Unsupervised Metrics

All the dashboard is time-related to the time frame that you select in that first part of the dashboard. 📅
Let's dive into the non-supervised metrics (i.e metrics that don't need any user input in order to calculate them).
Inference Time (ms)

If you use our Serverless Deployment Service, the inference Time is calculated with the post-processing step.
This is a simple way to monitor the sanity of your prediction's API and have an overview of the global latency of your model.
Please note also, all the points are linked to the corresponding prediction if you have logged the input images 👍.
Input Image Width & Height
You can monitor if the input images sent to your prediction API change in orientation over time with this graph.
You might find that your users send portrait pic at day, and horizontal pic at night who knows?

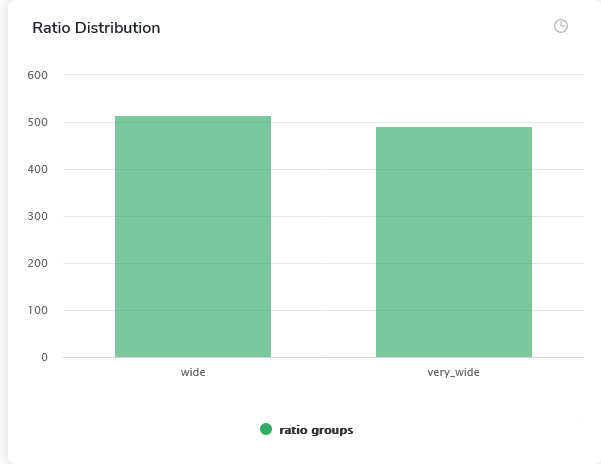
Image Ratio Distribution
ìmage_ratio = ìmg_width / img_height`
We provide an Image Ratio Distribution which is an histogram view segregated in 6 intervals:
- square :
image_ratio== 1 - tall :
image_ratio< 0.5 - very-tall : 0.5 <
image_ratio< 1 - wide: 1 <
image_ratio< 1.5 - very-wide : 1.5 <
image_ratio< 2.5 - extrem-wide : 2.5 <
image_ratio

Image area distribution
We also display the area distribution of your input images in order to quickly validate your images.

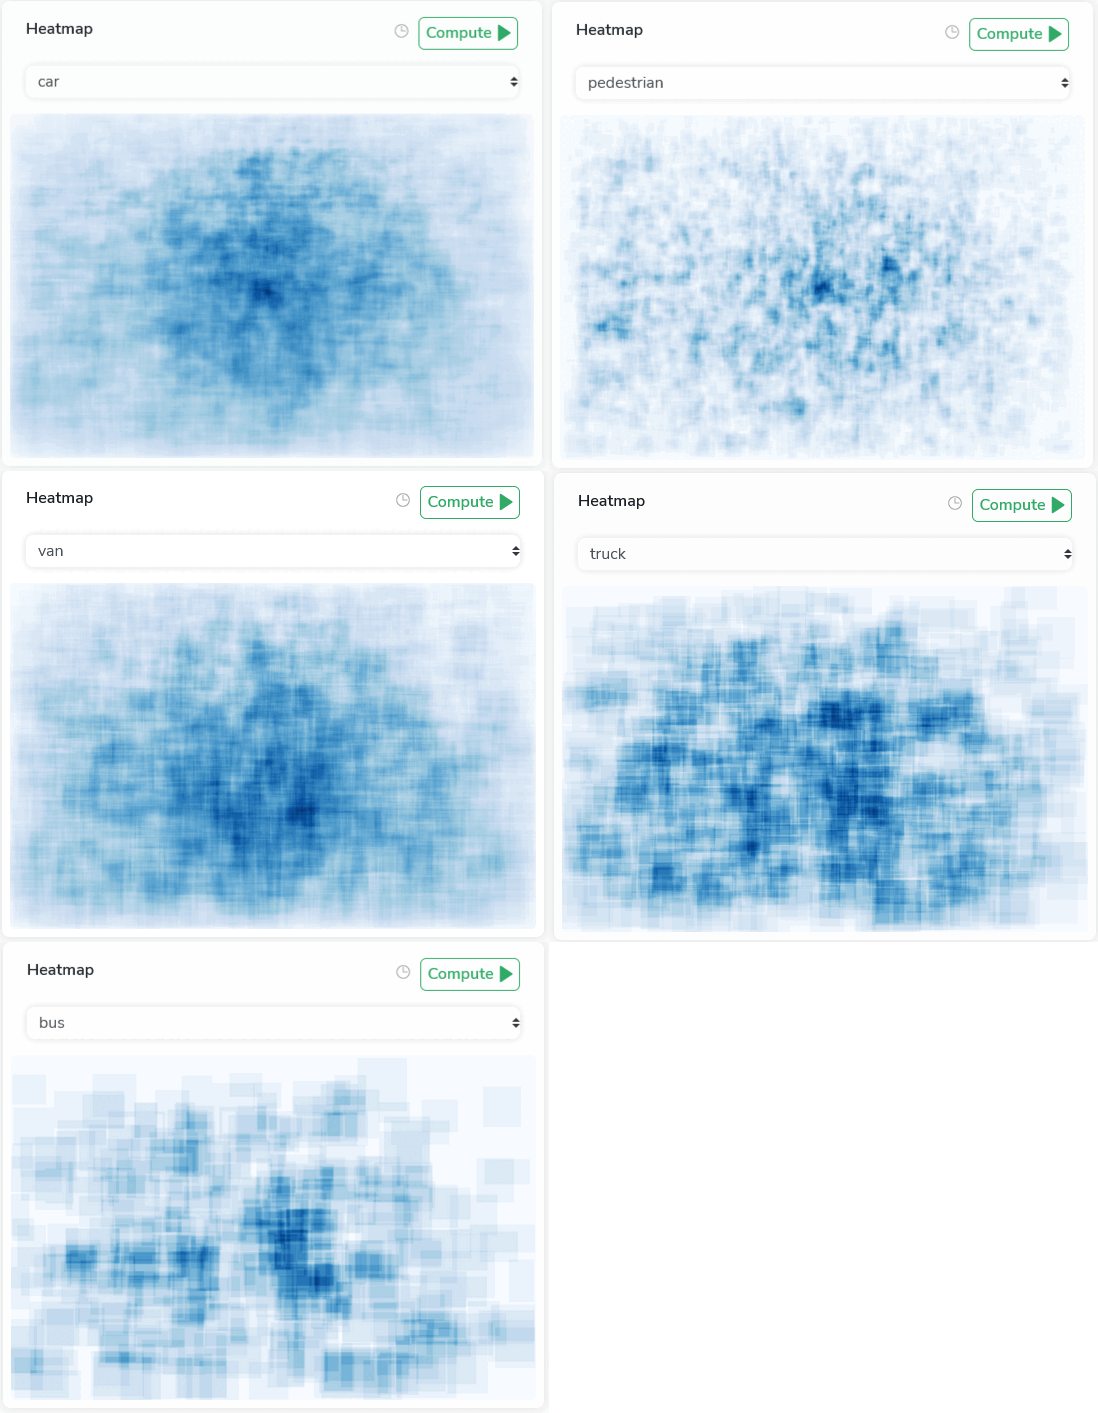
Prediction Heat Map
You can access a class-based heat map for all the predictions allowing you to quickly assess the spatial distribution of your predictions.

Last 5 predictions
You can access a quick overview of your last 5 predictions.

This is not real-time
Please bear in mind that if not real-time, new predictions might appear during the time in your dashboard
AE Outlier Score
This a little bit more complex so we decided to dedicate a whole page for it :)
👉 AE Outlier Check it out!
KS Drift
This a little bit more complex so we decided to dedicate a whole page for it :)
👉 KS Drift ( Kolmogorov-Smirnov Test) Check it out!
Updated over 1 year ago