Deployments - Setup Alerts
Picsellia offers you the possibility to define Alerts on a Deployment.
SuchAlerts are really useful to ensure you are well-notified if something is going wrong with your Deployment.
These Alerts are defined on metrics that are available in the Dashboard. For instance, if the image sent for inferences are drifting or if the latency is abnormally high.
1. Create or edit an Alert
From a given Deployment, you can create a new Alert by reaching the Settings tab and particularly the Alerts panel.
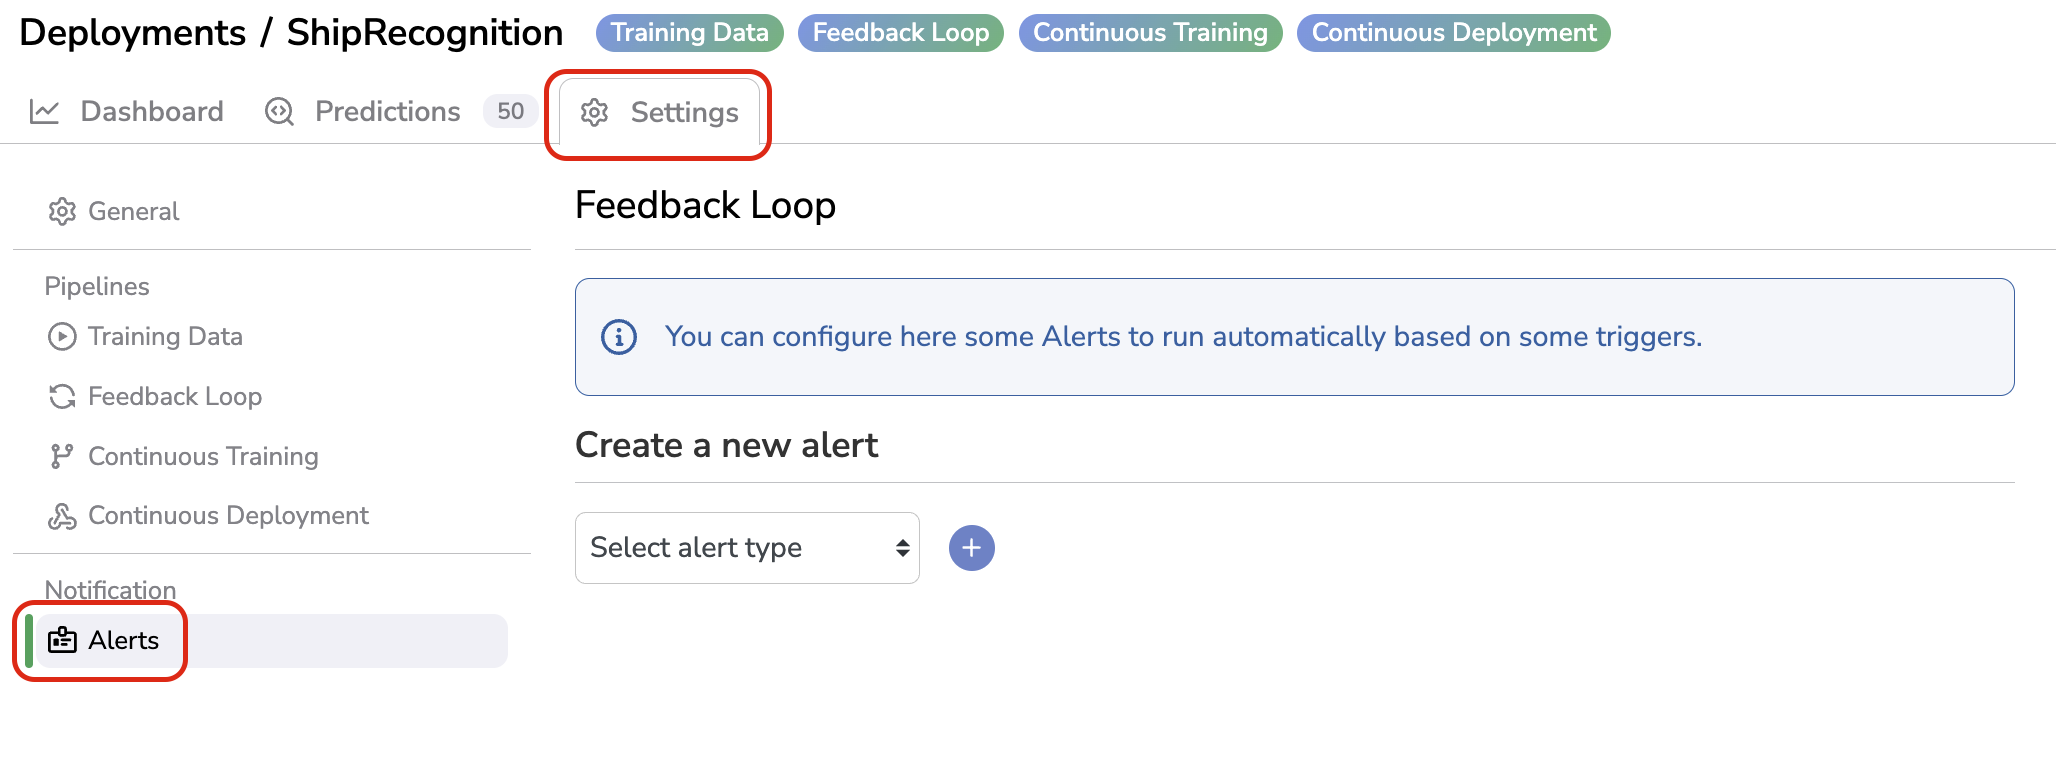
Alerts panel
From this view, you can visualize theAlerts already defined in the frame of the current Deployment, edit them, or create new ones.
The Alert creation can be done from the Create a new alert section, by selecting the metric to monitor through the dropdown as shown below:
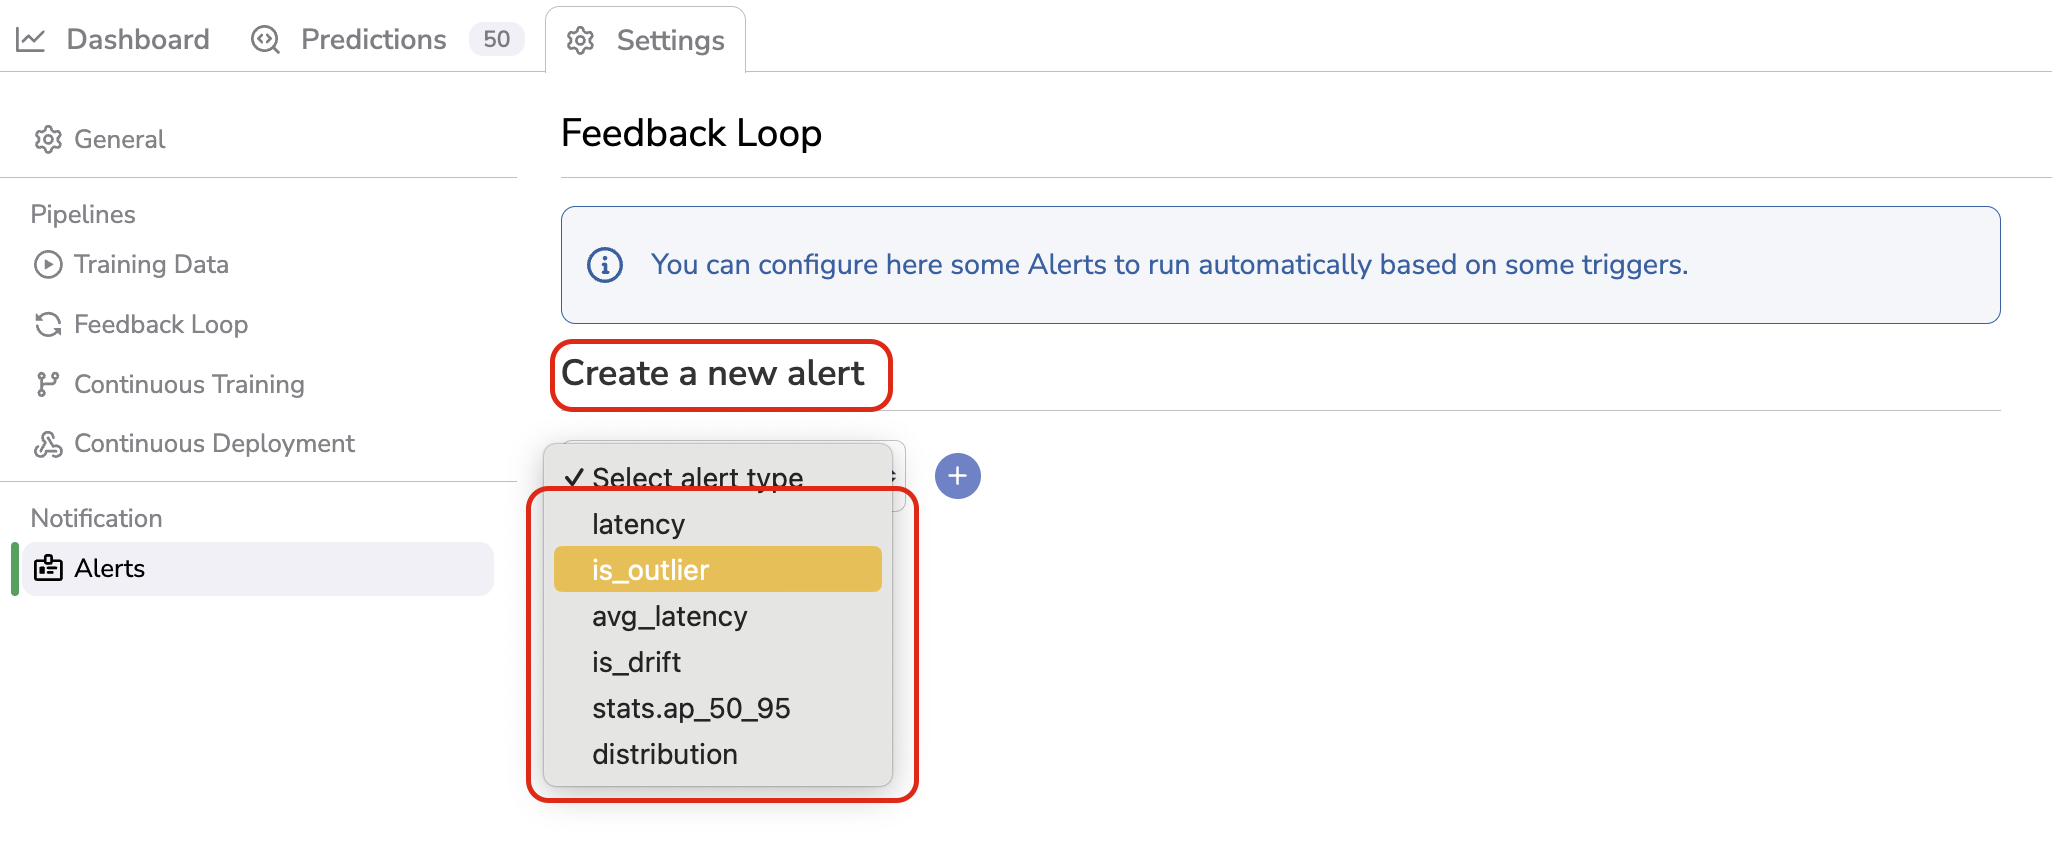
Selection of the metric to monitor
Once the metric is selected, you can define the threshold that will, when triggered, generate a notification. Once defined, you just need to click on the blue + button to complete the Alert creation:
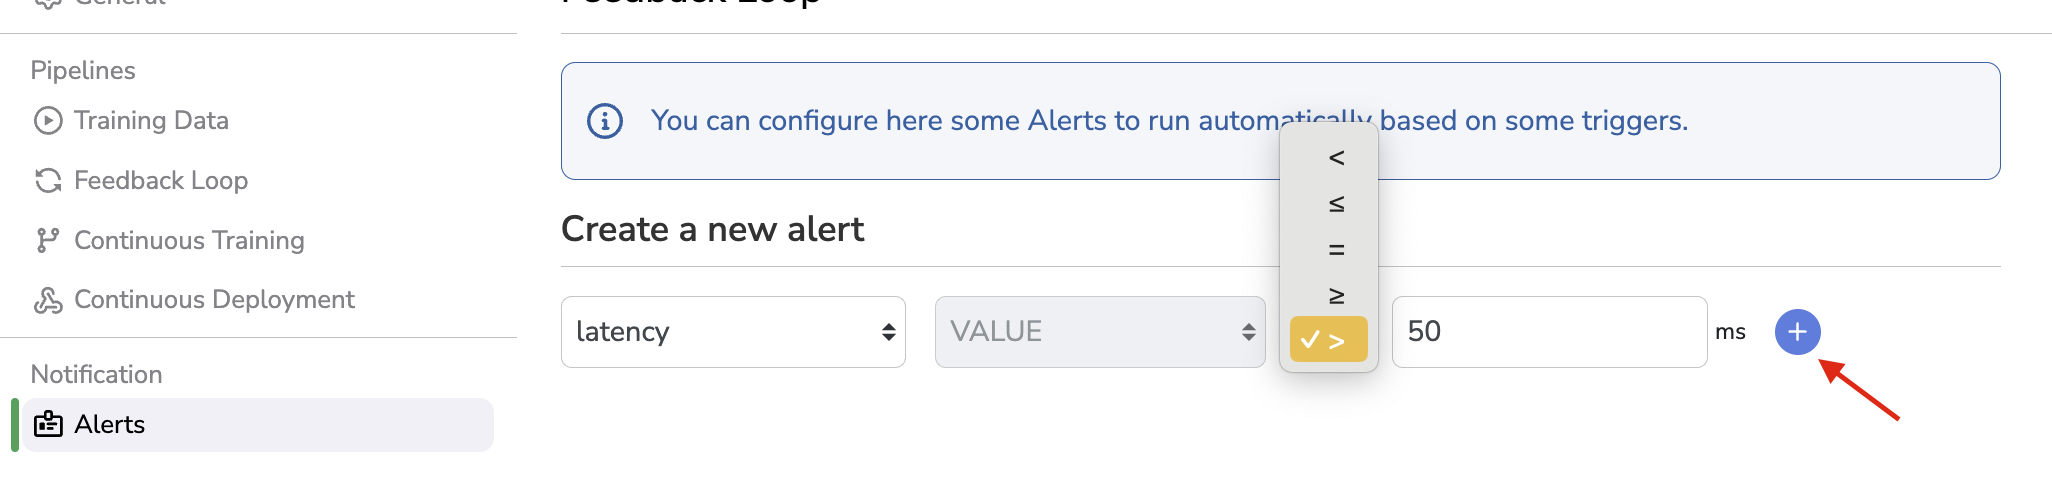
Alert definition and creation
Once created the Alert is displayed as shown below:
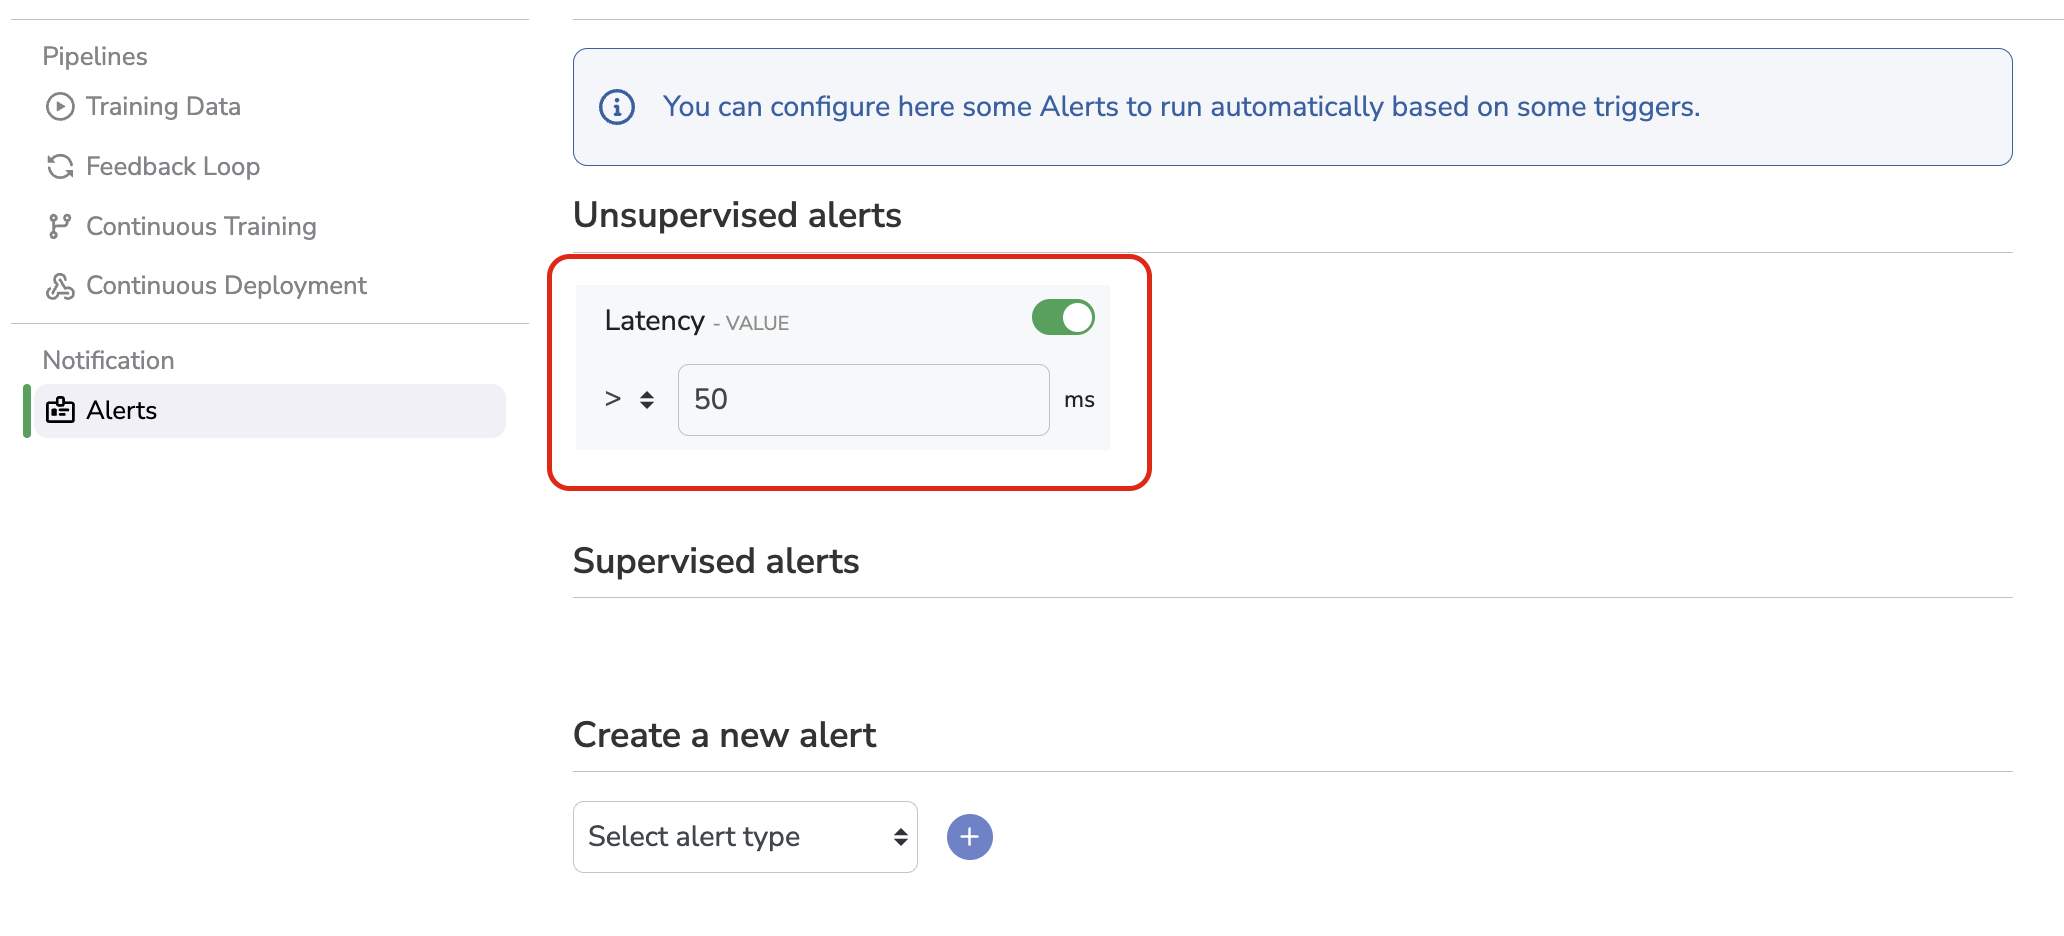
Existing Alerts
As you can see Alerts are divided into two categories (i.e. Unsupervised alerts & Supervised Alerts) based on the type of metric they are supervising: Unsupervised Metric or Supervised Metric.
2. Edit Alerts
Still from the Alerts section in the Settings of a given Deployment, you can by clicking on the radio button deactivate or reactive an Alert. Obviously, once deactivated, an Alert can not be triggered.
You also modify the operator or the Threshold value of an existing Alert as shown below:
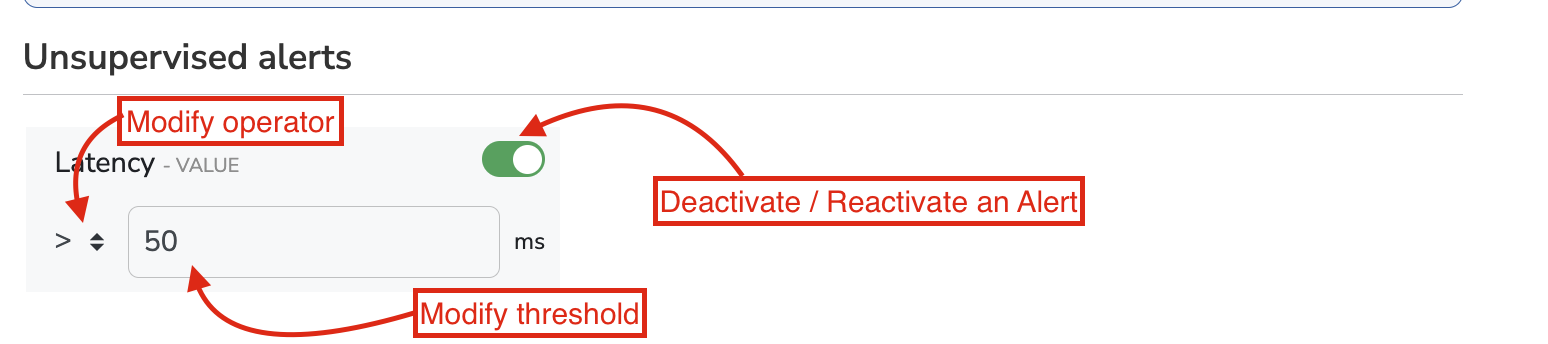
Modify existing alert
Do not forget to click on Save after each modification on an existing Alert:
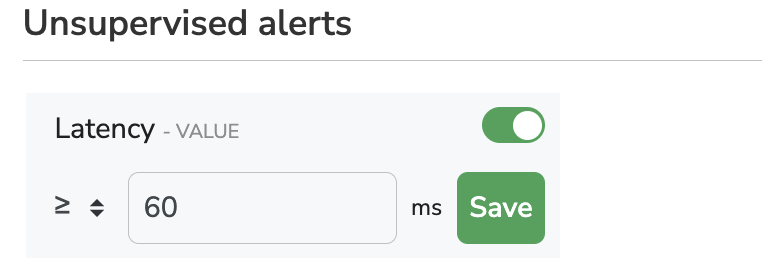
Save modifications on an Alert
2. Visualize triggered Alerts
Now that Alerts are properly configured according to your need, you can go back to the Dashboard tab.
In the Dashboard, you will see quickly if any Alert has been recently triggered.
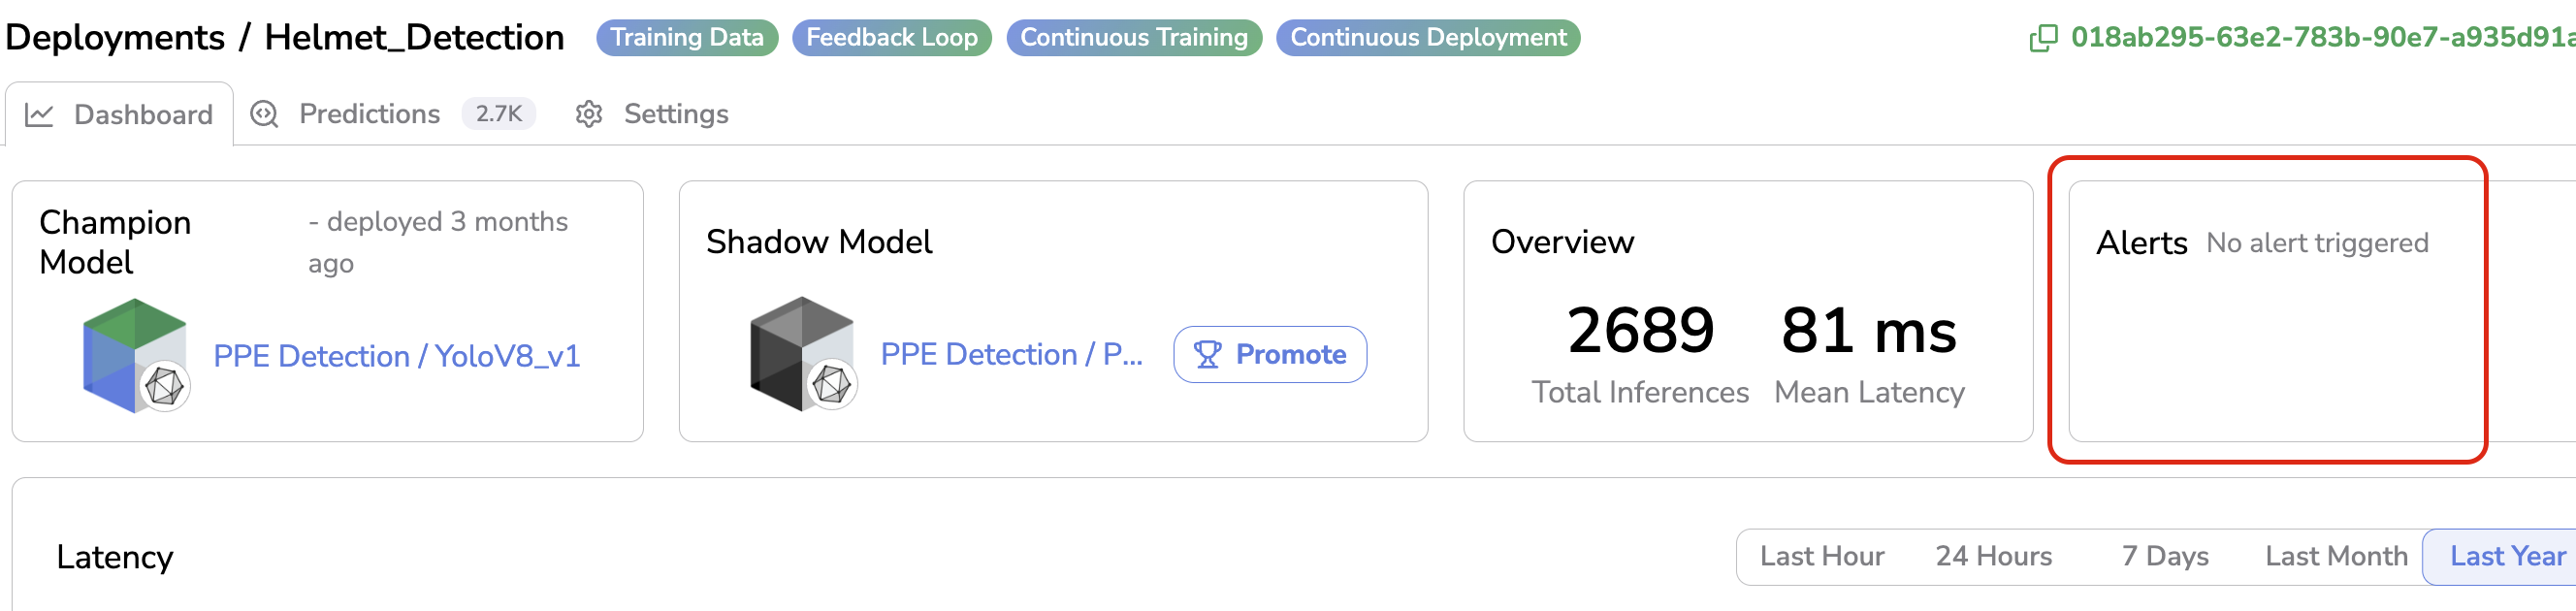
Triggered Alert section
Updated about 1 year ago