Experiment - Evaluation
The purpose of creating a Project and performing several Experiment in its frame is basically to train the best-performing ModelVersion. To do so we saw on the previous page how to log Metrics in the Experiment Tracking dashboard that will bring insights to the user allowing him to assess the quality of the training done. In addition to the Metrics, Picsellia also allows you to compare on a dedicated bench of images the Prediction done by the freshly trained model with the GroundTruth, this is called an Evaluation.
By leveraging the Evaluation interface, the user will be able to get a precise overview of the model's behavior, get performance metrics on each evaluated image, and identify easily the contexts in which the model is performing well or not.
With Metrics and Evaluation, the user will have all the insights needed to assess the quality of the trained ModelVersion, understand why it is behaving in such a way, and identify ways to improve its performance in a further Experiment.
1. Create Evaluation
EvaluationBasically, the creation of Evaluation is done by your training script. It needs to get a bunch of images unused during the training phase and already annotated in order to use them as GroundTruth.
The creation of this bunch of images can be done by the training script splitting the DatasetVersion attached to the Experiment or by using a DatasetVersion dedicated to Evaluation attached to the Experiment with an alias indicating its purpose.
Then the script will make the just-trained ModelVersion infer from the evaluation images and send the result to the Picsellia Experiment.
The outcome is that you will be able to compare for each evaluation image, the Prediction done by the ModelVersion and the GroundTruth pulled from the original DatasetVersion. You will also access evaluation metrics computed by Picsellia based on the comparison of Prediciton & GroundTruth.
The creation of Evaluation is already integrated into almost all the training scripts attached to ModelVersion from the Public registry.
However, if you are using your own training script integrated with Picsellia, you can use this dedicated tutorial detailing how to create and log Evaluation within your Picsellia Experiment.
2. Evaluation interface
From an Experiment, you can access the Evaluations tab as shown below:
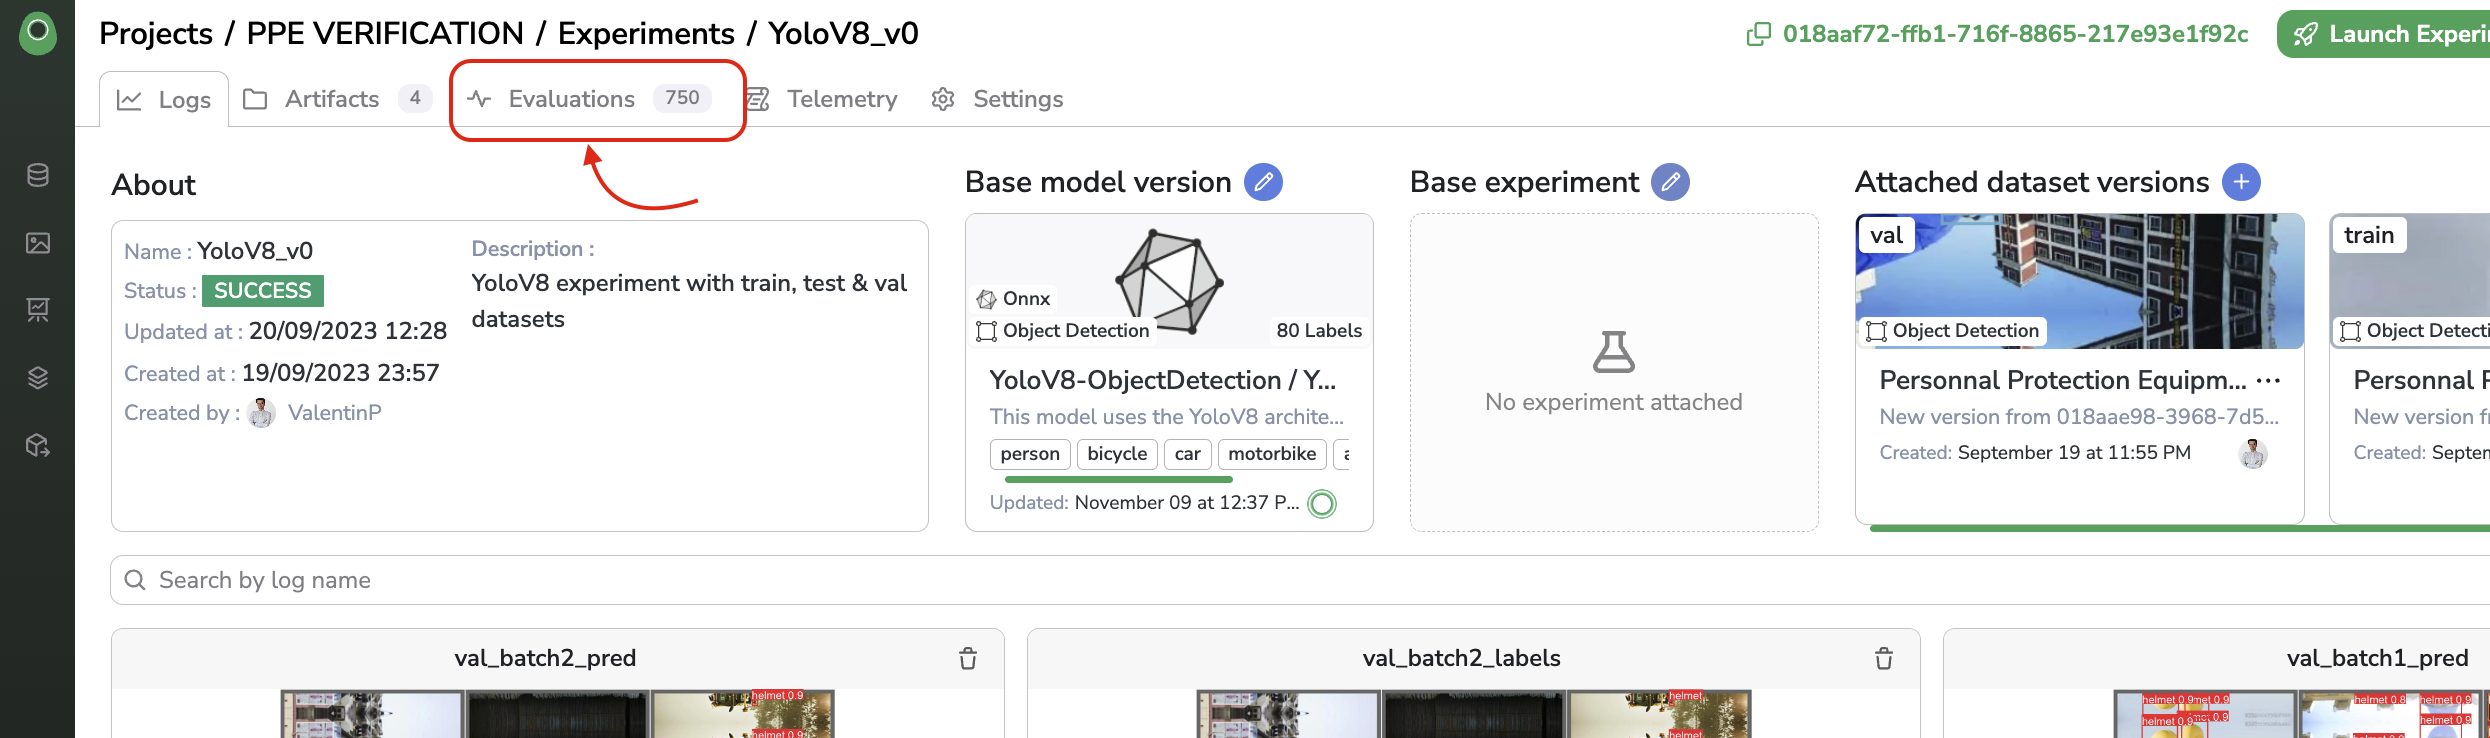
Evaluations tab
Obviously, after the Experiment creation, the Evaluation interface is empty. It is only once the training script has been executed successfully that Evaluation are created in the Evaluation interface.
The Evaluation interface offers a way to visualize and explore Evaluation with the same philosophy and features as the Datalake to browse among Data or a DatasetVersion to browse among Asset.
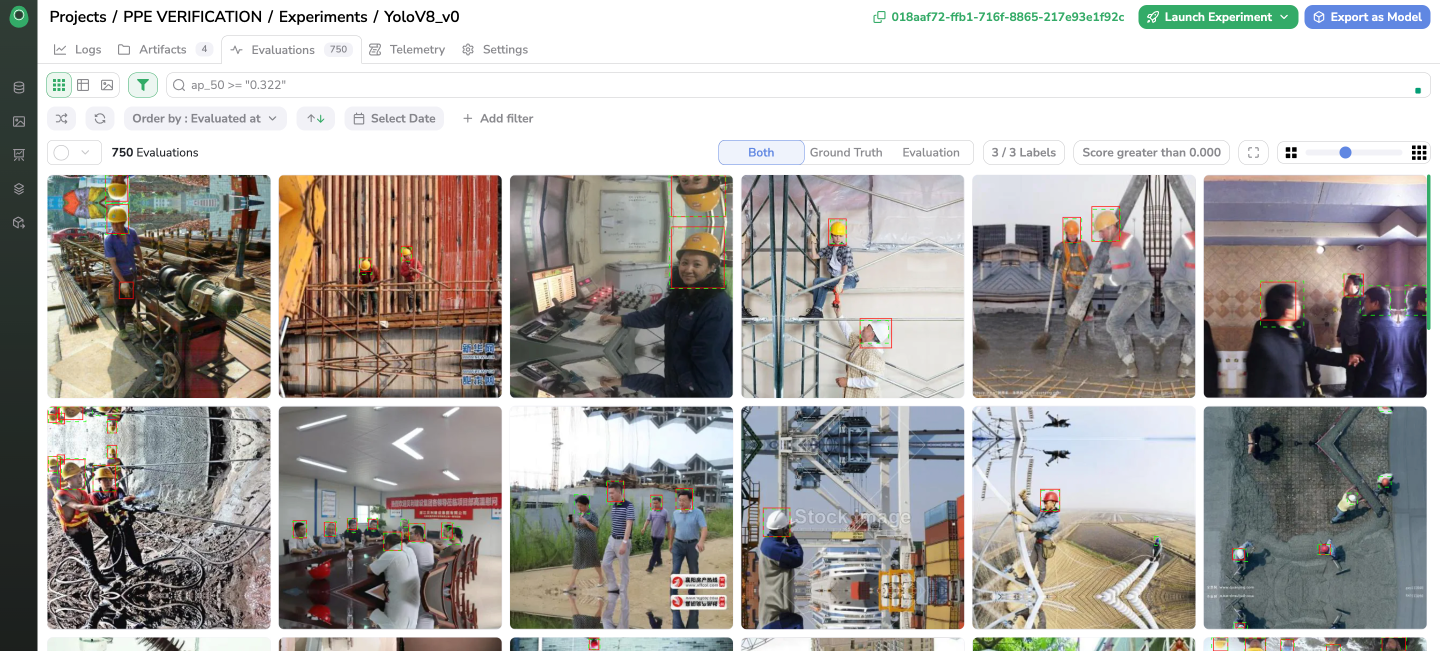
Evaluation Interface
A. Evaluation visualization
Evaluation visualizationa. Evalaution Views
Evalaution ViewsAs a consequence, you will retrieve three different views:
-
Grid view, allowing to visualize many
Evaluationat a time -
Table view, allowing to visualize quickly many
Evaluationand associated information (filename, Width, Height, detection performances) -
Details view, allowing to visualize one
Evaluationin detail (full-screen image display and associated information)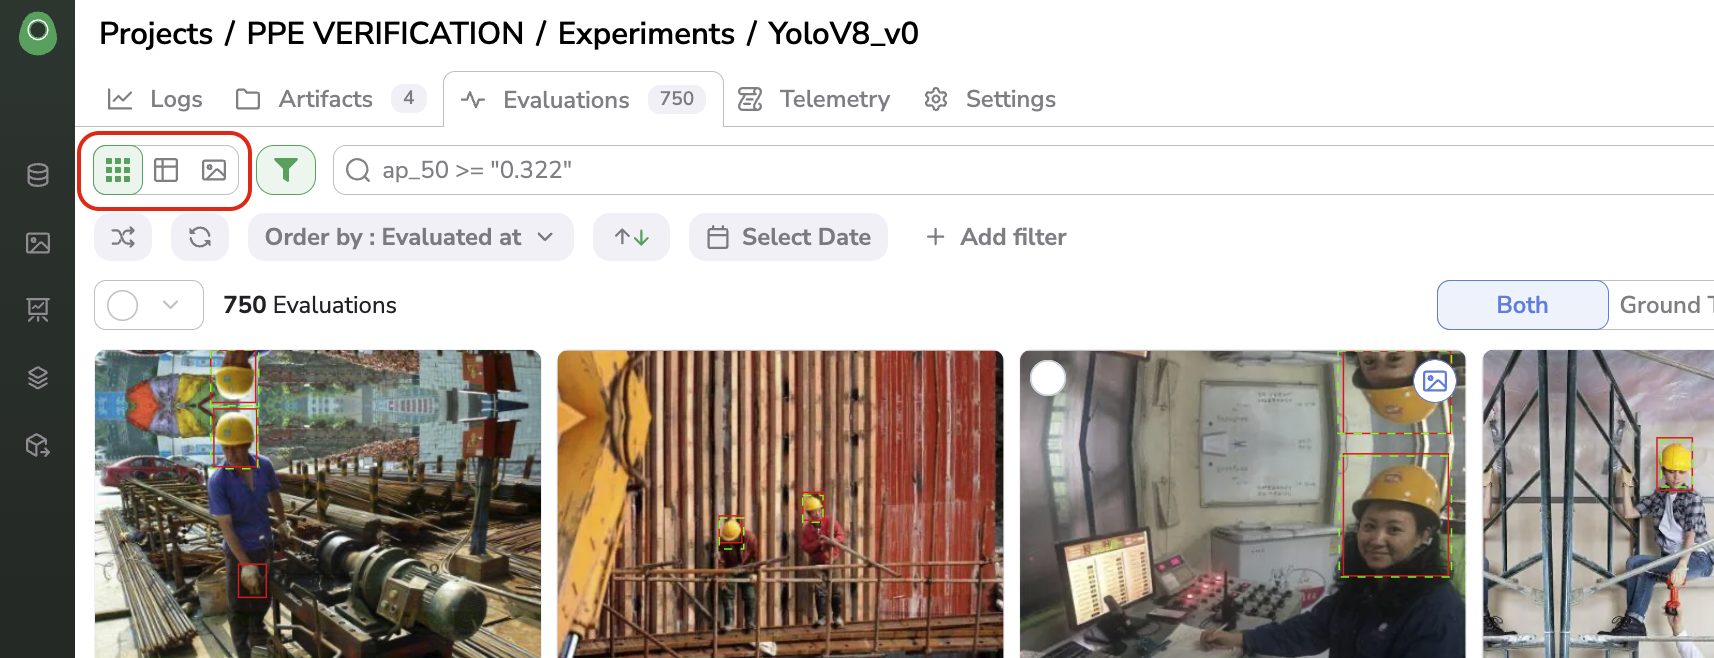
Switch between views
Depending on the view, you can still modify the aspect ratio (for Grid & Details views) and the size of the thumbnail displayed (for Grid view only)
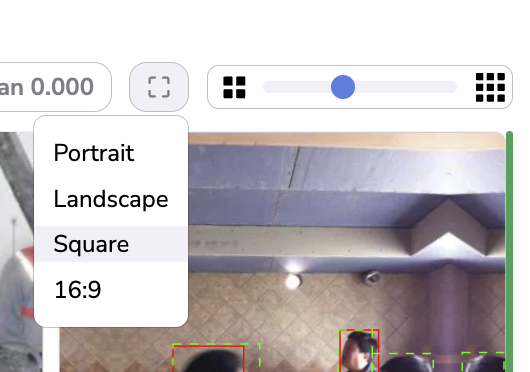
Modify the aspect ratio and thumbnail size with the Grid view
b. Evaluation Shape
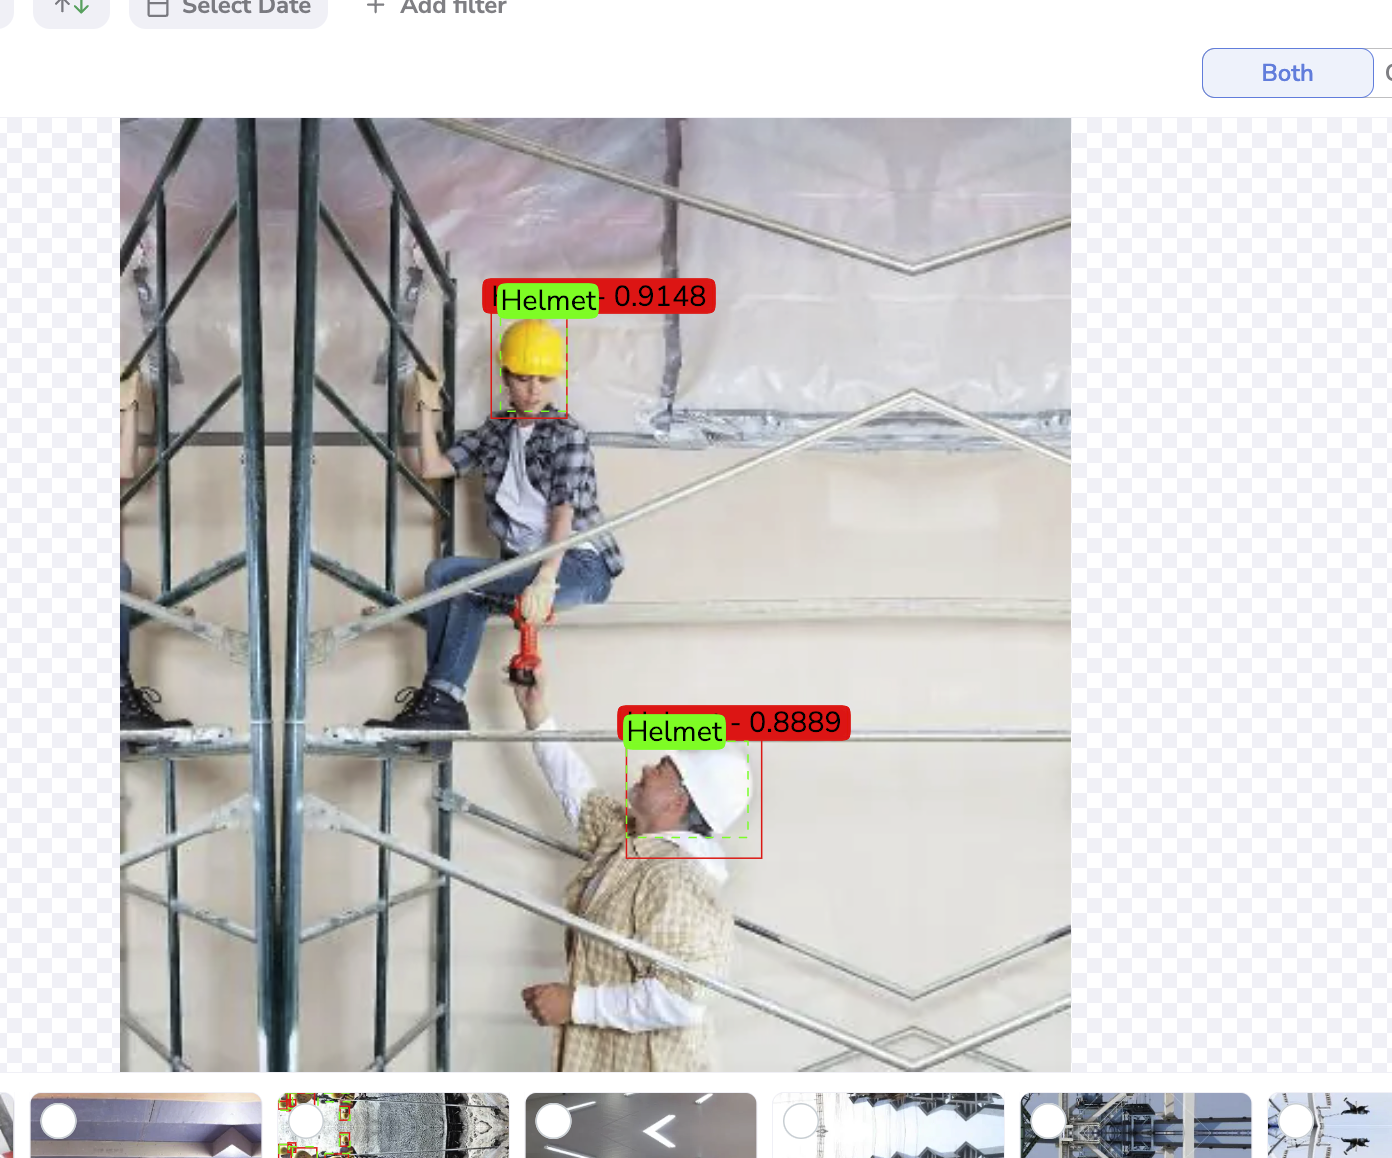
ShapeFor each Evaluation, you can obviously visualize, the image, but also the superposition of the Prediction done by the trained ModelVersion and the GroundTruth inherited from the DatasetVersion.
The GroundTruth Shape are displayed in green whereas the Predicted Shape are red. For each Shape, the associated Label is displayed along with the confidence score in the case of Predictions.
Evaluation visualization
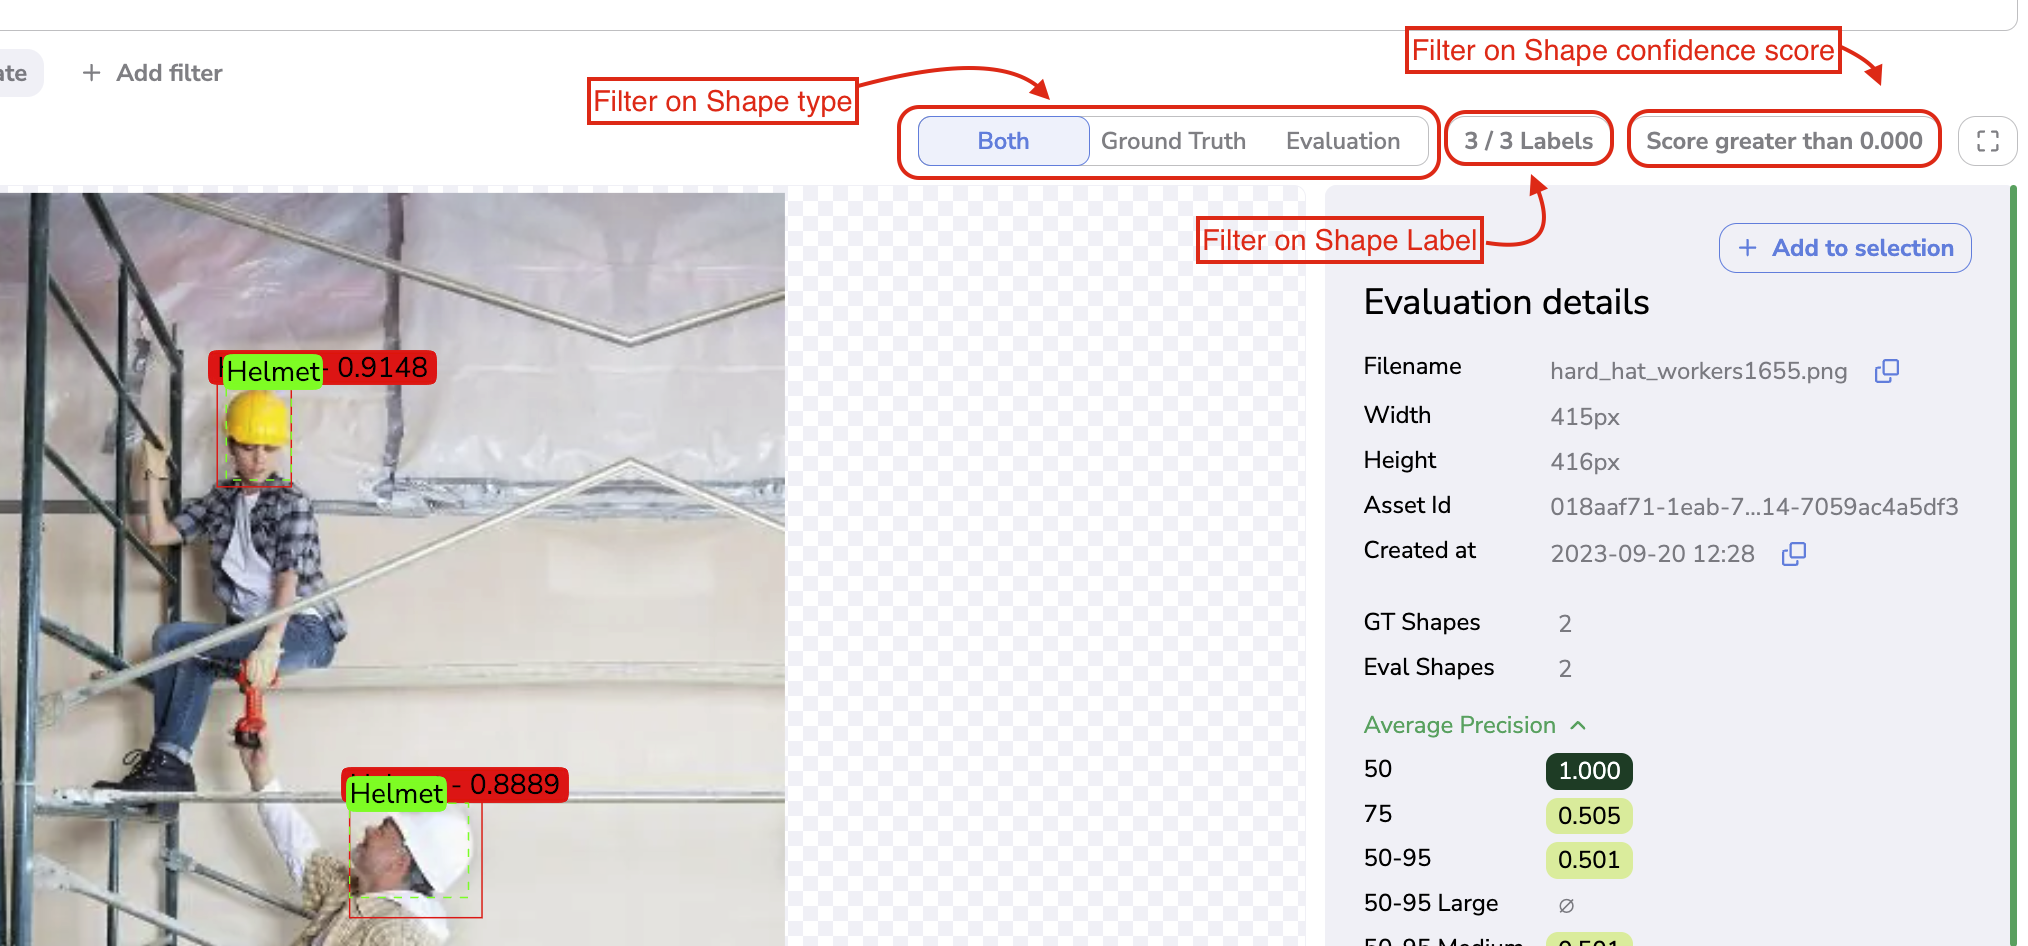
In order to ensure the smoothest visualization possible, you have the possibility to select the element to display on your image.
First, you can choose to display on your Evaluation image only the GroundTruth, only the Predictions, or Both. You can also filter the Shape to display by Label or by confidence score (in case of Prediction).
Filter on Shape to display
c. Evaluation metrics
Evaluation metricsAs explained previously, for each Evaluation, Picsellia compares GroundTruth and Prediction to compute different metrics allowing the user to assess the quality of the Prediction done by the ModelVersion on this particular image.
Those metrics can be visualized in the Table & Details views as shown below:
Metrics computed for an Evaluation on Details view
For each Evaluation, in addition to the filename, AssetID and Creation date, the user can access
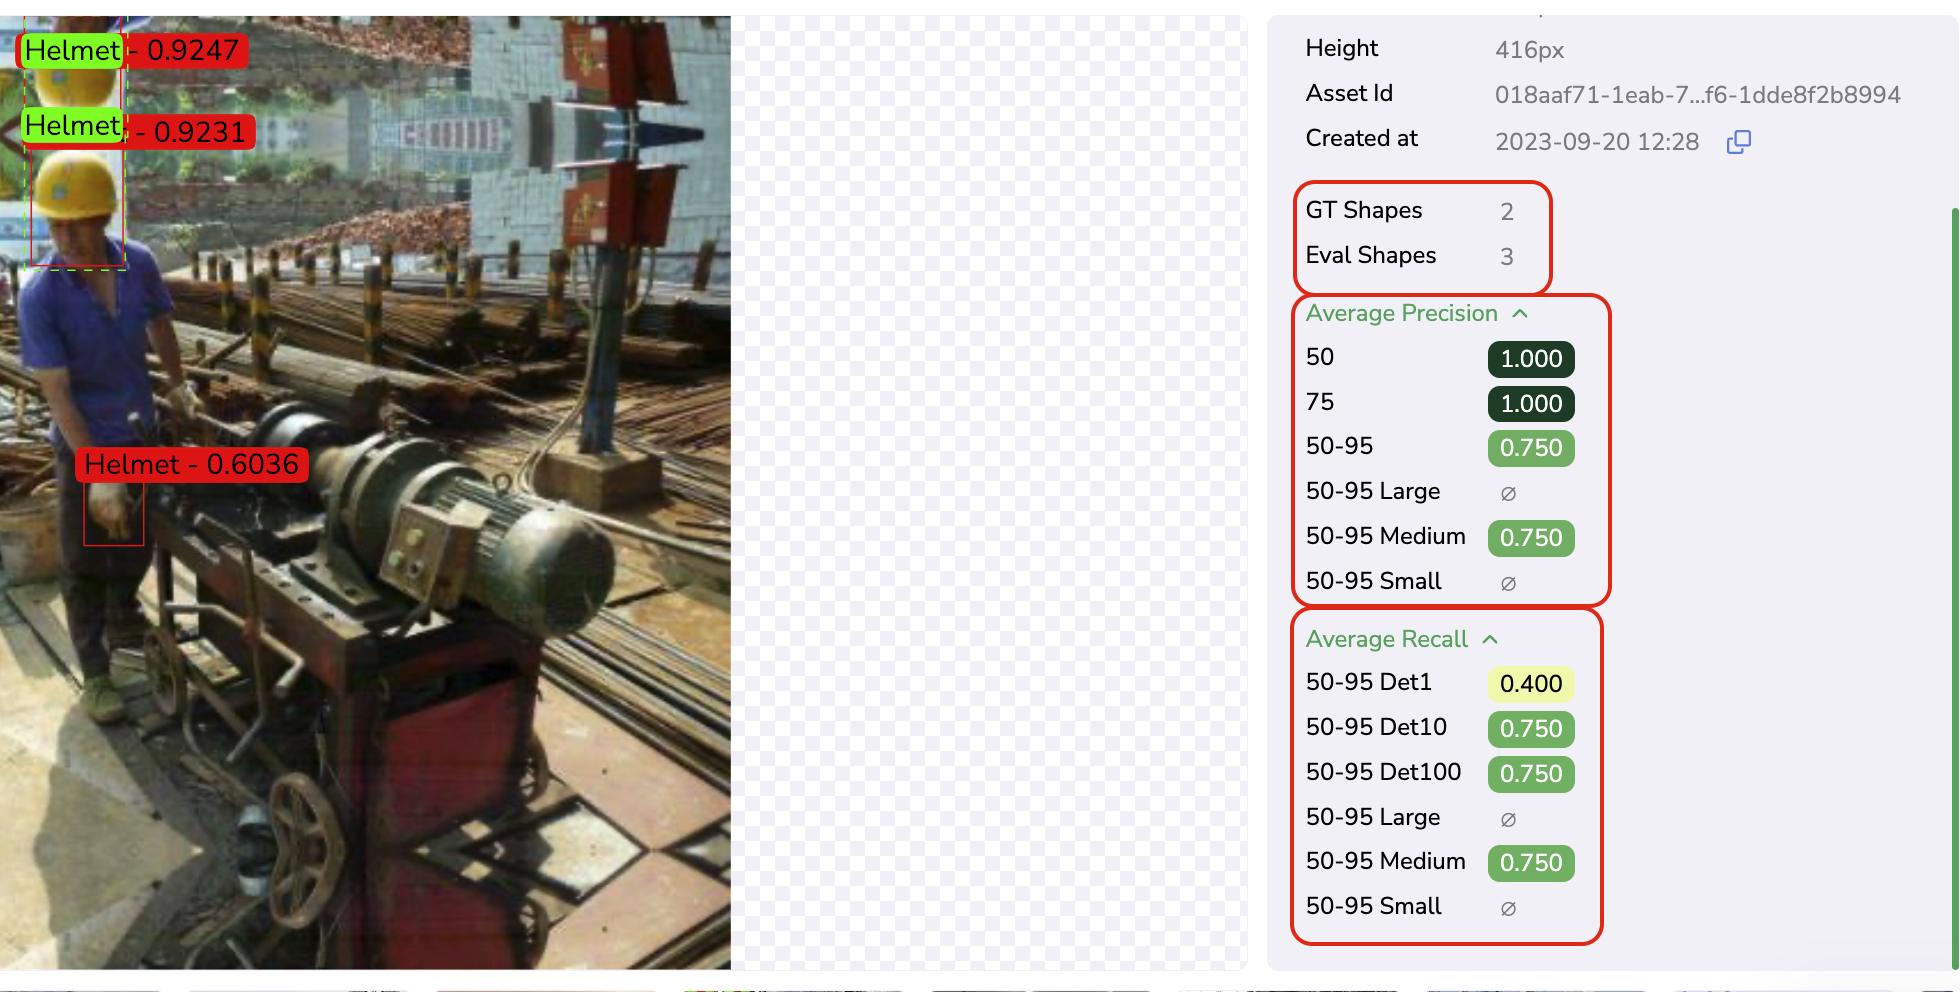
- The number of GroundTruth
Shapevs the number of PredictedShape - Average Precision score for different IoUs
- Average Recall score for different IoUs
Not applicable for ClassificationThose metrics are computed only in case of
Evaluationperfomed in the frame of anExperimentwith DetectionType Object Detection or Segmentation. For Classification, please refer to the dedicated section at the end of this page.
B. Evaluation ordering
Evaluation orderingTo access ordering or filtering features, the user can open a related toolbar by clicking on the Filters button as shown below
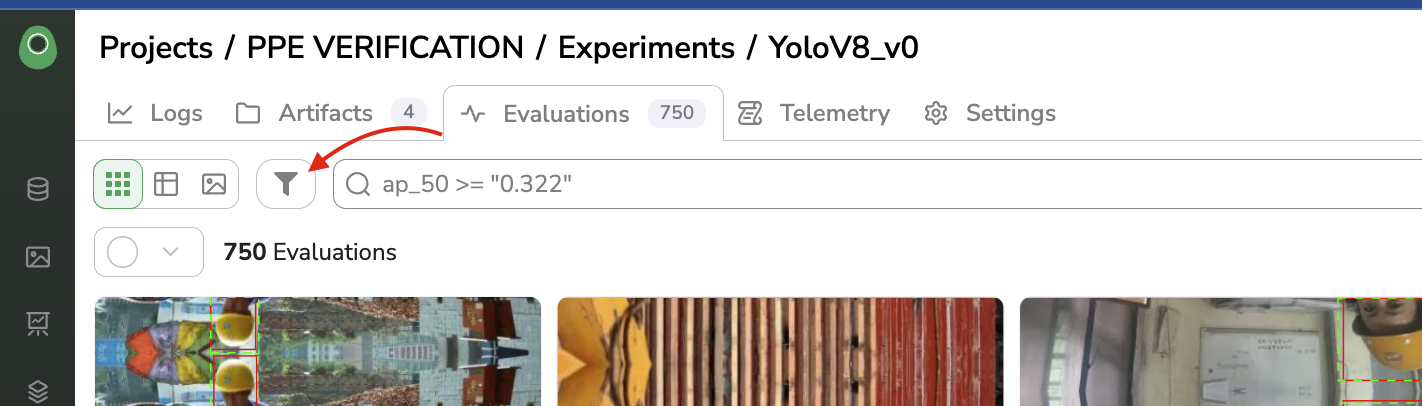
Open filters toolbar
The Evaluation can be ordered ascendingly or descendingly by filename or evaluation date.
The user can also decide to randomize the display of Evaluation.
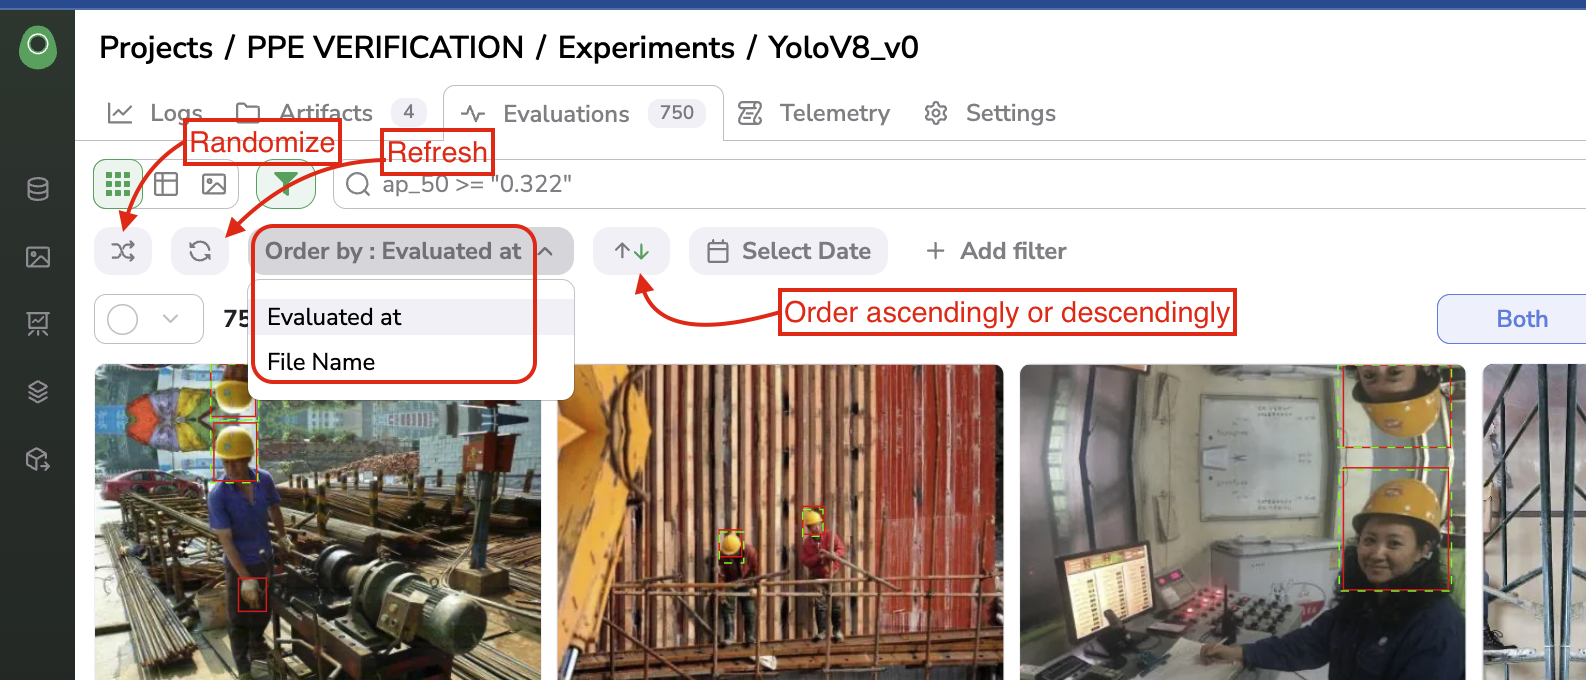
Ordering features
C. Evaluation filtering
Evaluation filteringIn order for users to investigate the Evaluation generated and under deeply the ModelVersion behavior, Evaluation can be filtered on several criteria.
a. Date
First of all, the date picker allows to filter Evaluation on their creation date by clicking on the Select date button. The date picker will open to let you select the timeframe to search on.
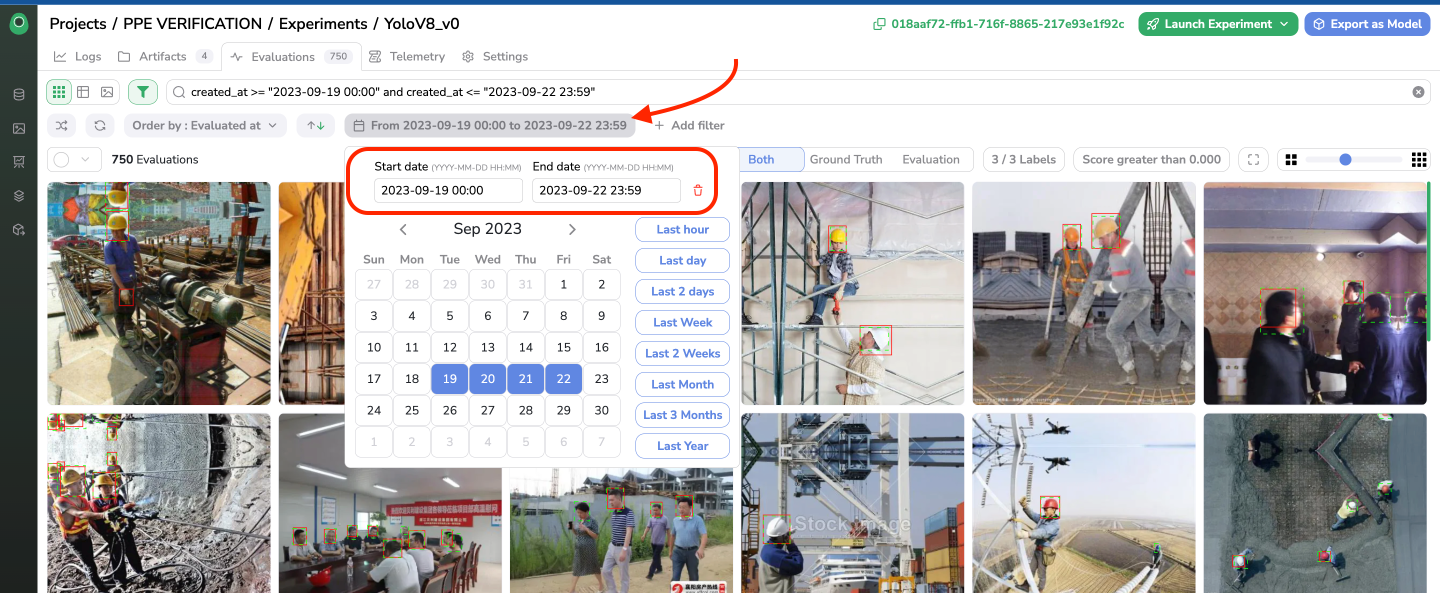
Filter Evaluation on date
As you can see below, once the date timeline is selected, the associated query is filled in the search bar, allowing you to complete it directly through the Search Bar for a more specific query.
b. Metrics
The Evaluation Interface also allows to filter on the computed metrics, to do so you just need to click on + Add filter and define through the modal, the metric, and its values to filter on. For instance, let's create a filter that will display only the Evaluation created between 09/19/2023 and 09/22/2023 and with Average Precision (IoU 50-95) between 0.291 and 0.782:
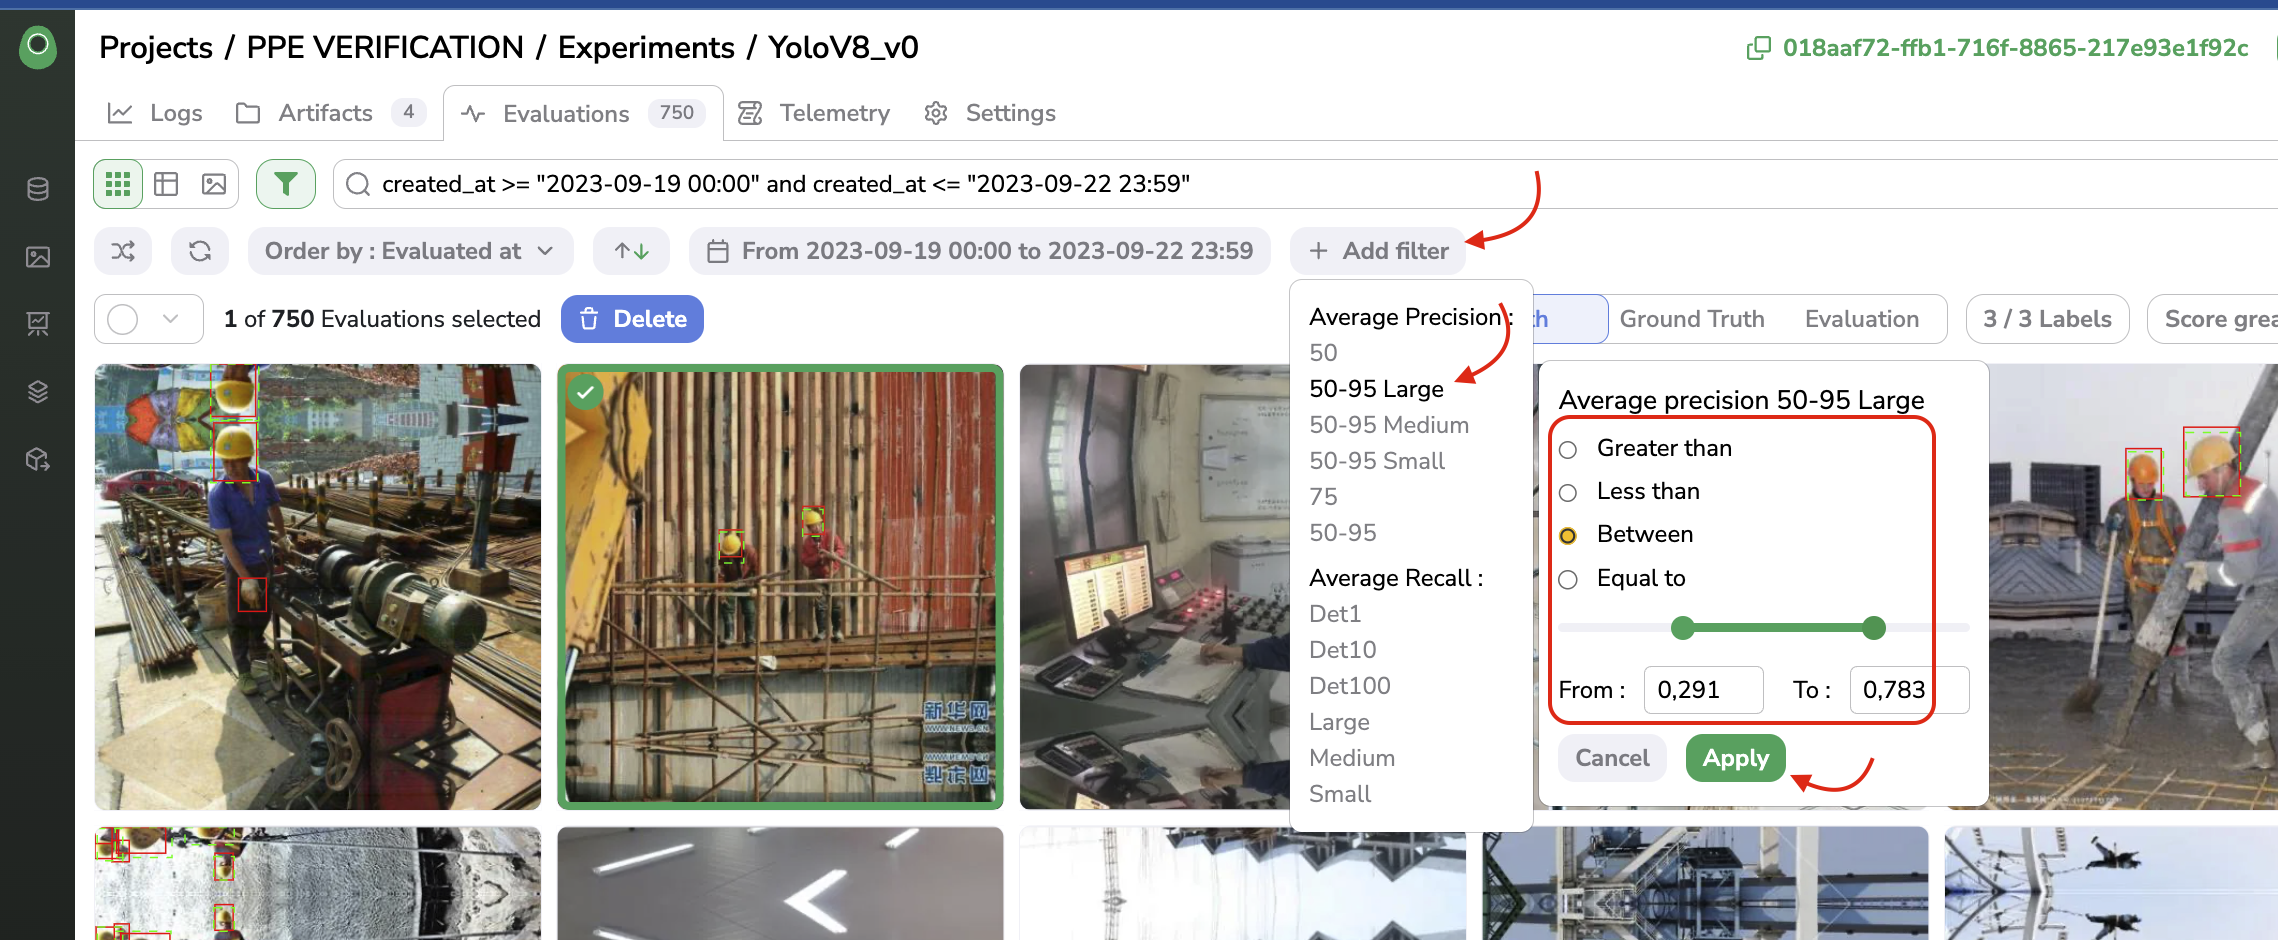
Filter Evaluation on the computed metrics
Once applied, the list of active filters (based on date or computed metric) is displayed as shown below:
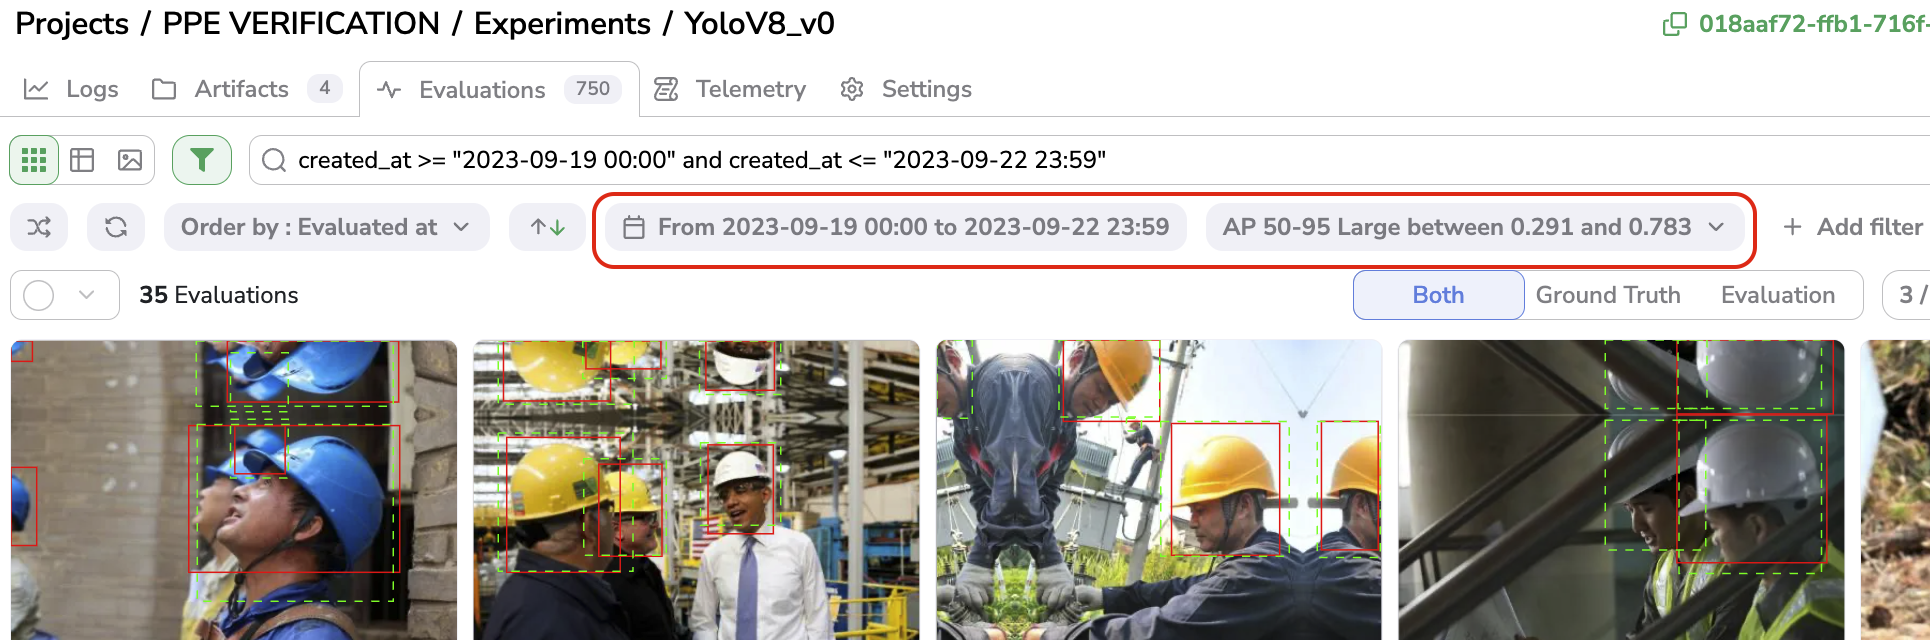
Filter Evaluation
Any filter can be removed anytime by clicking on it first and on the trash icon.
D. Search Bar
As is the case for all the image visualization views available on Picsellia, you have access to the Search Bar powered by our Query Langage. This Search Bar allows you to create complex queries leveraging all the properties related to each Evaluation.
The Query Language allows you to browse among properties of the image itself (linked to an Asset), of the GroundTruth Annotation or the Prediction Annotation. You can rely on the auto-completion to get all the properties you can search on.
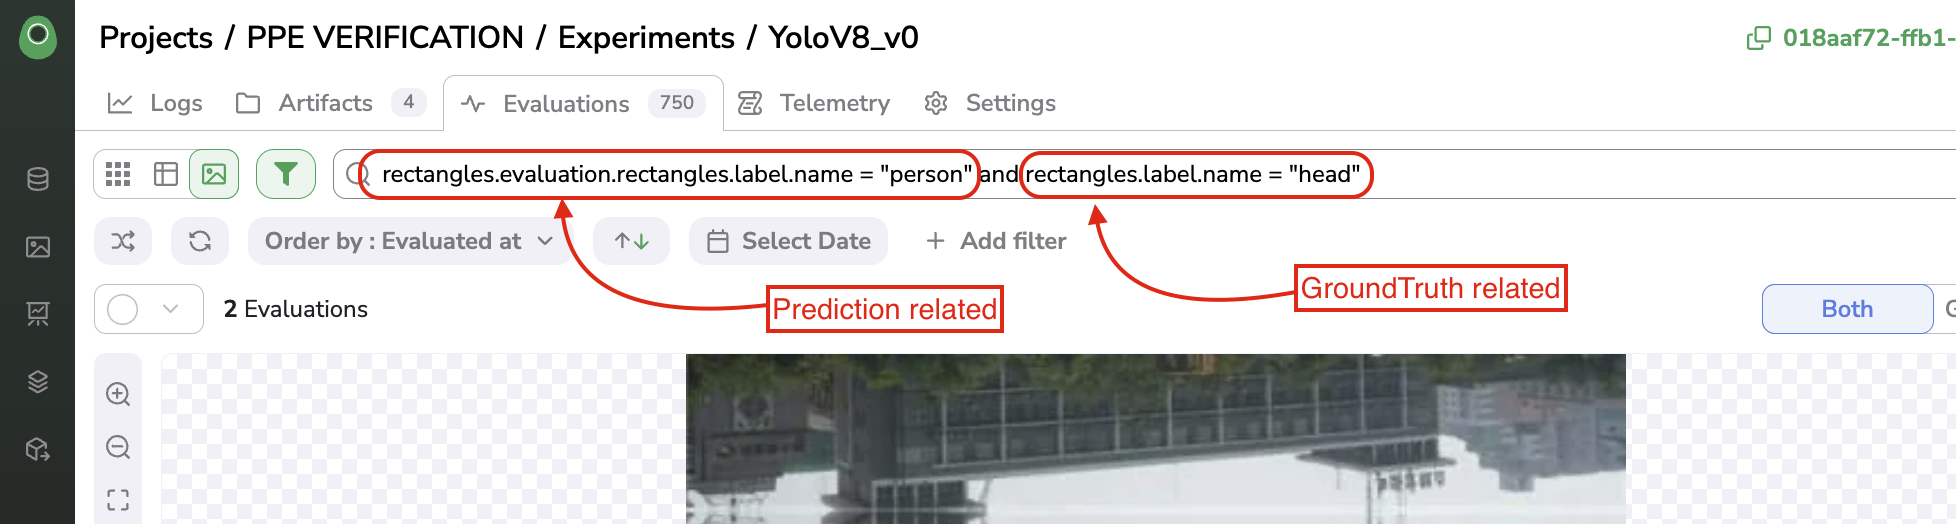
Use Search Bar in the Evaluation Interface.
E. Evaluation deletion
Evaluation deletionIn case you need to delete any Evaluation computed, you just need to select the to-be-deleted Evaluation and click on Delete.
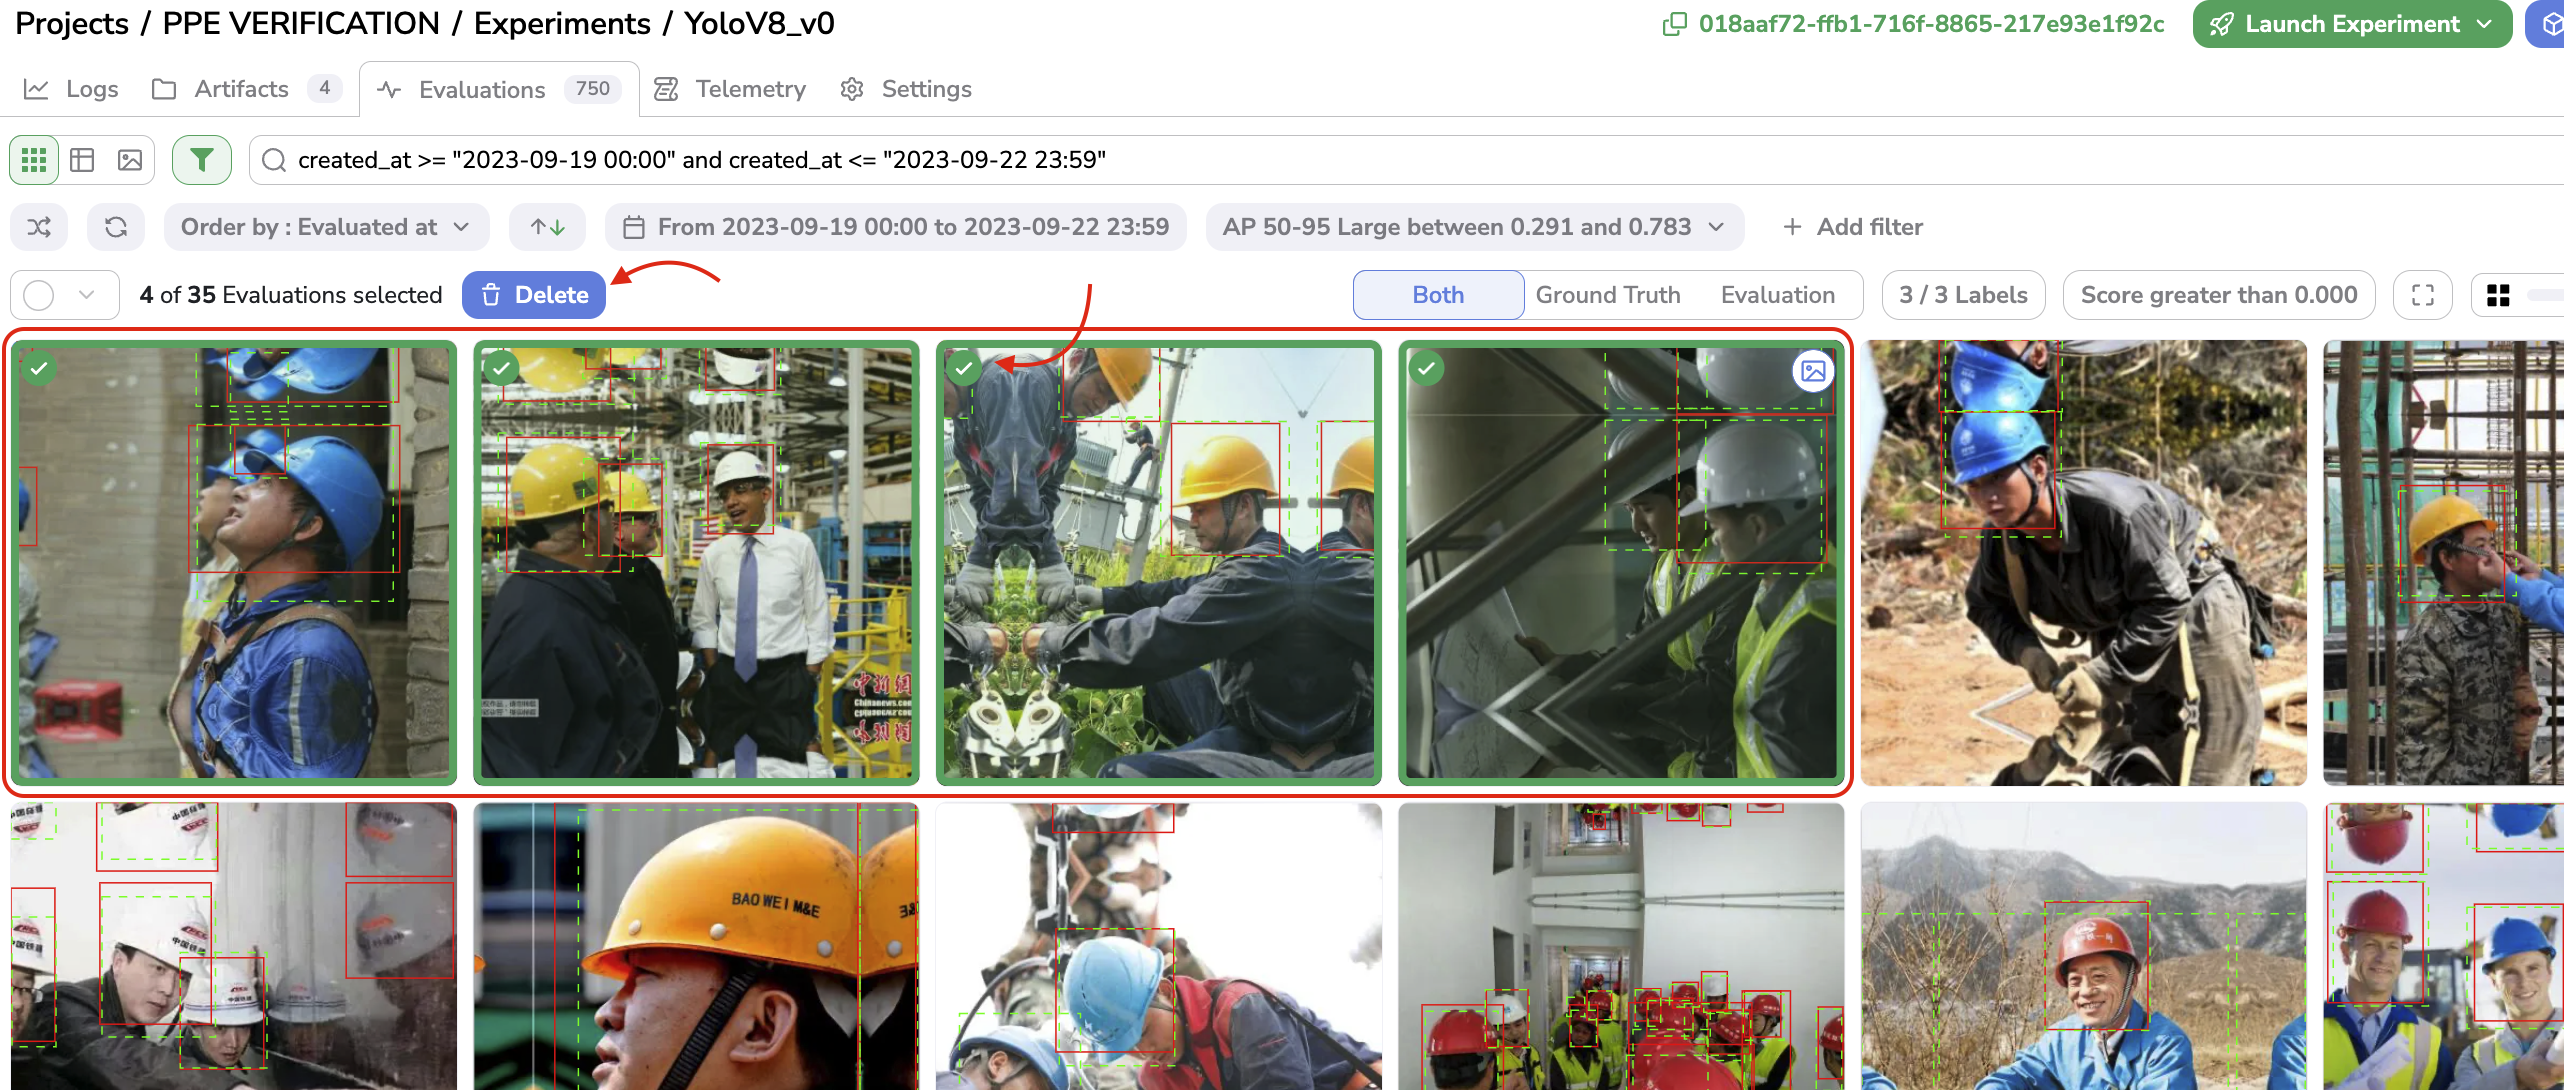
Evaluation deletion
3. Classification
The case of Classification is handled a bit differently than Object Detection or Segmentation in the Evaluation Interface. This is mainly due to the fact that Average Recall and Average Precision metrics don't make sense for Classification Experiment.
The creation of Evaluation for Classification by a training script is detailed here.
Most of the features remain the same compared to what has been detailed previously.
The visualisation of GroundTruth and Prediction on each Evaluation follows the same guideline with the GroundTruth Label in green and the Predicted Label (and associated confidence score) in red.
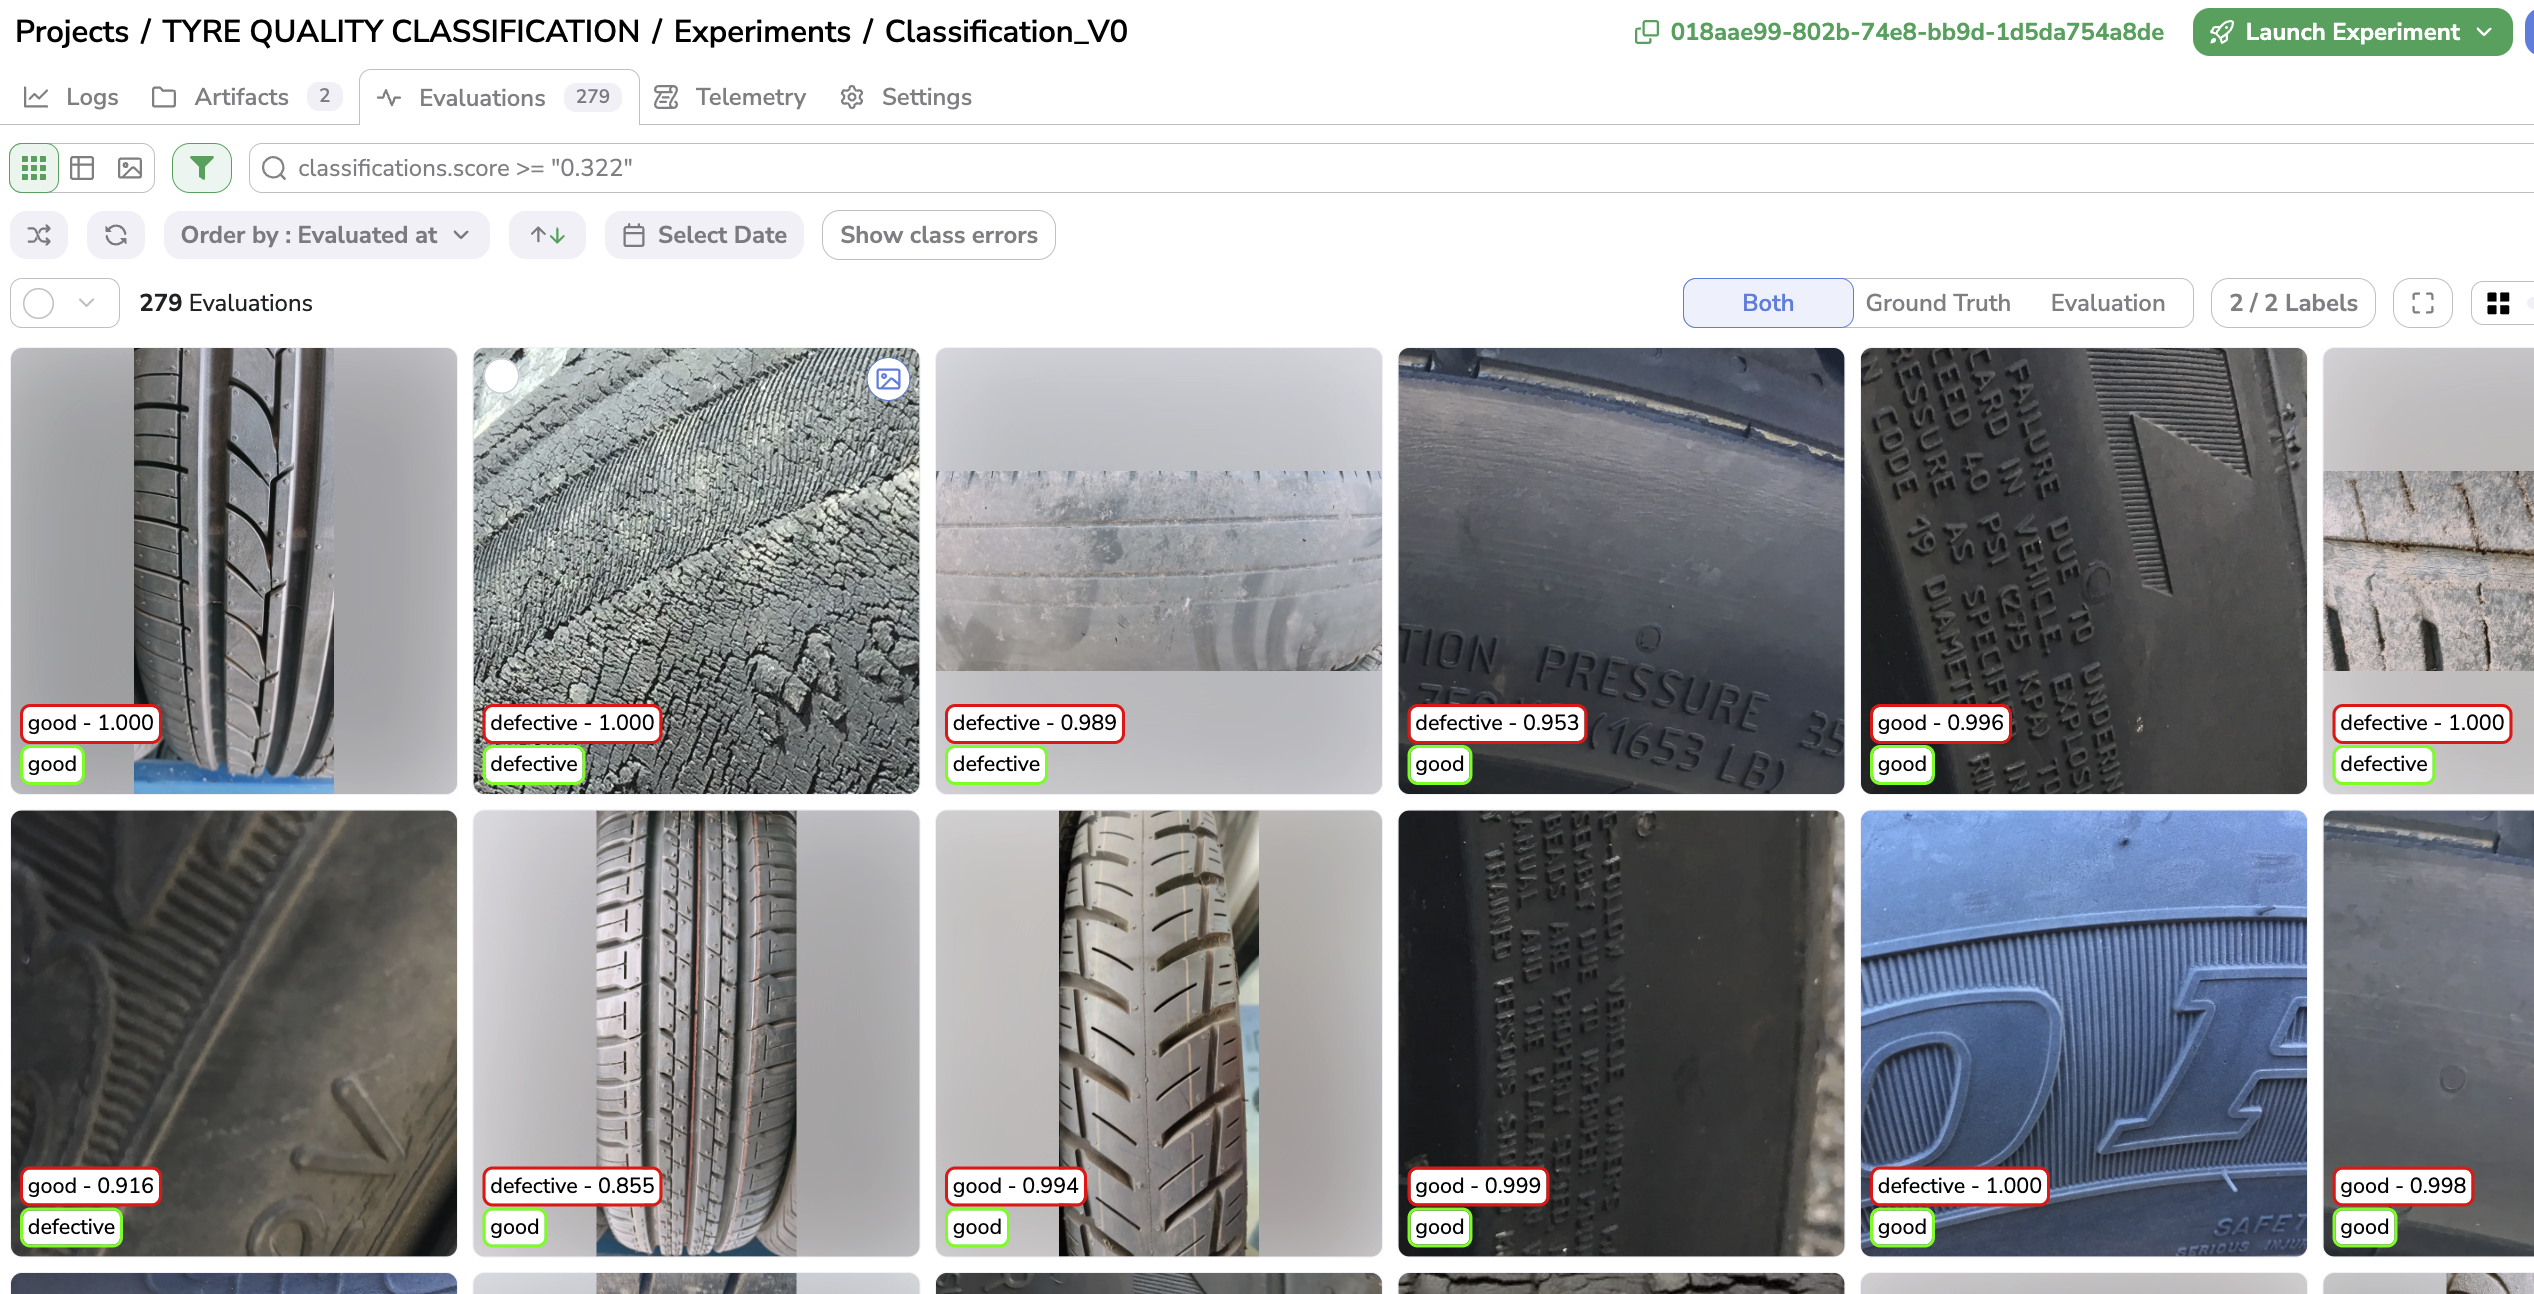
Classification Evaluation
The other major difference lies in the computed metrics. For Classification Evaluation it is the confidence score (refered as Score on the Evaluation Interface) of the Prediction that is displayed and usable to create filters.
The GroundTruth & Predicted Label are also displayed as fields in the Table & Details views.
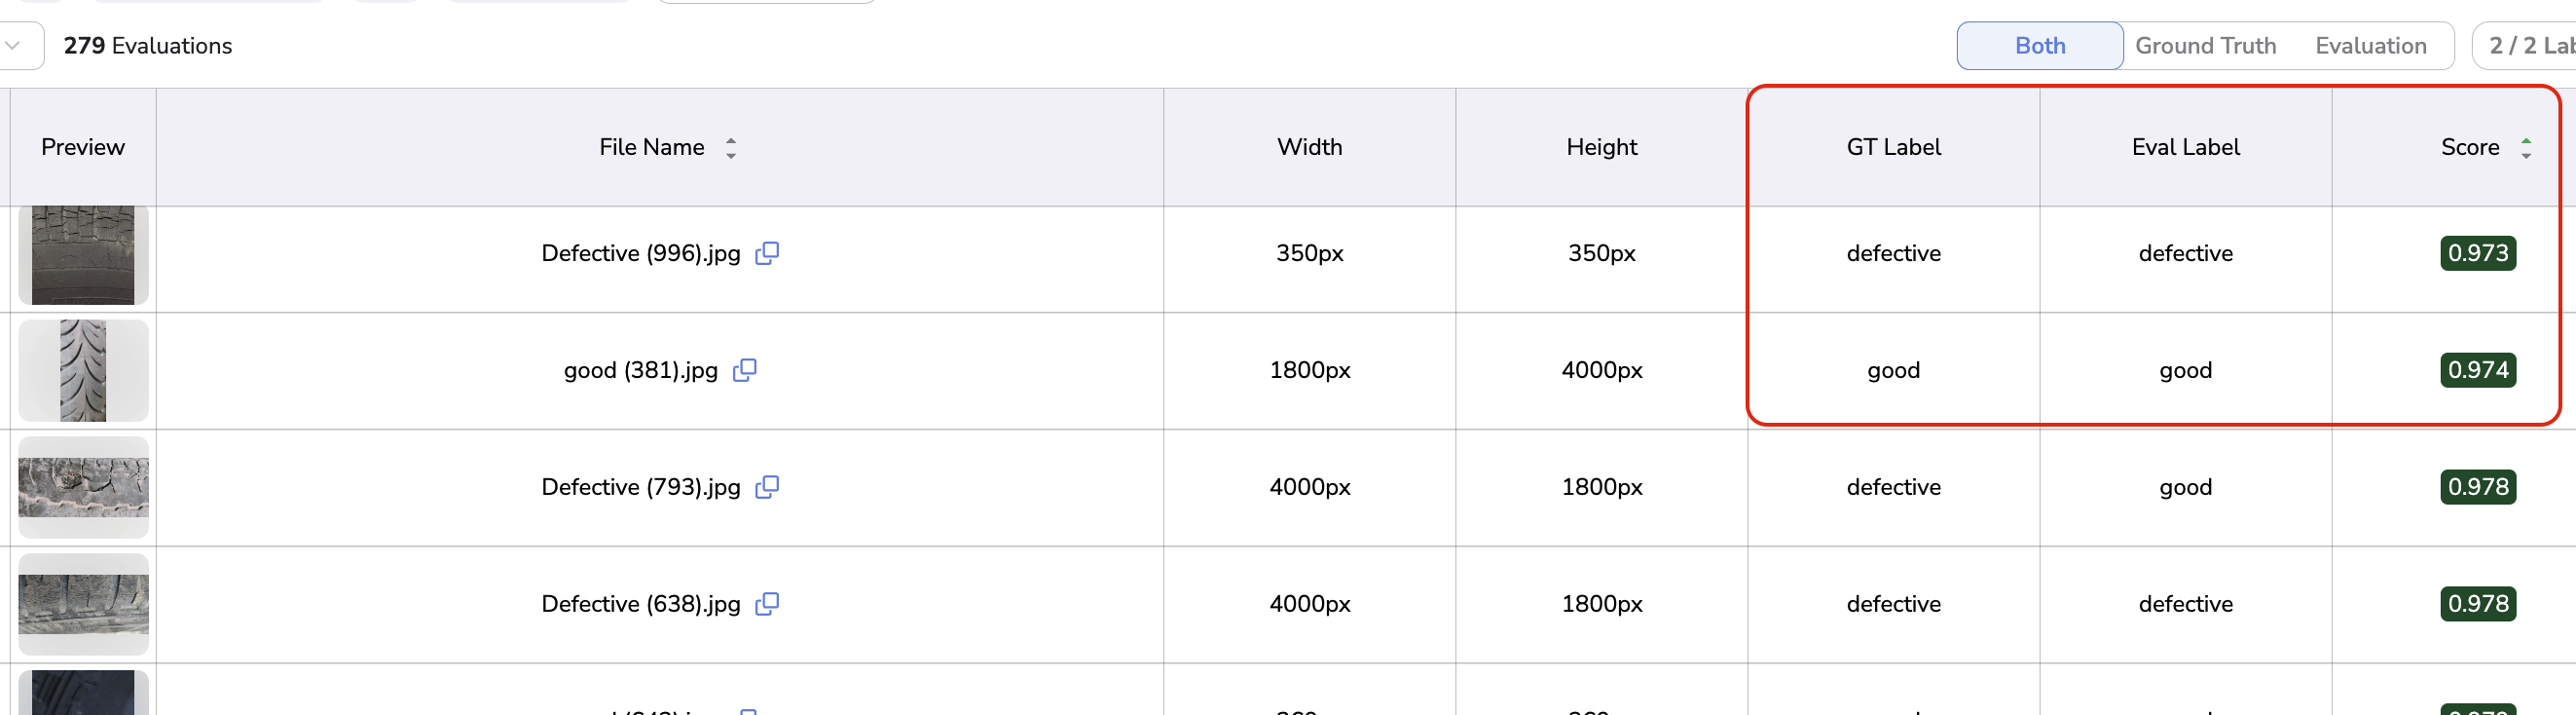
Classification Evaluation Score and Label
In order to quickly access the Evaluation where the GroundTruth Label is different from the Evaluated one, you can click on the Show class errors button available when the Filters bar has been opened.
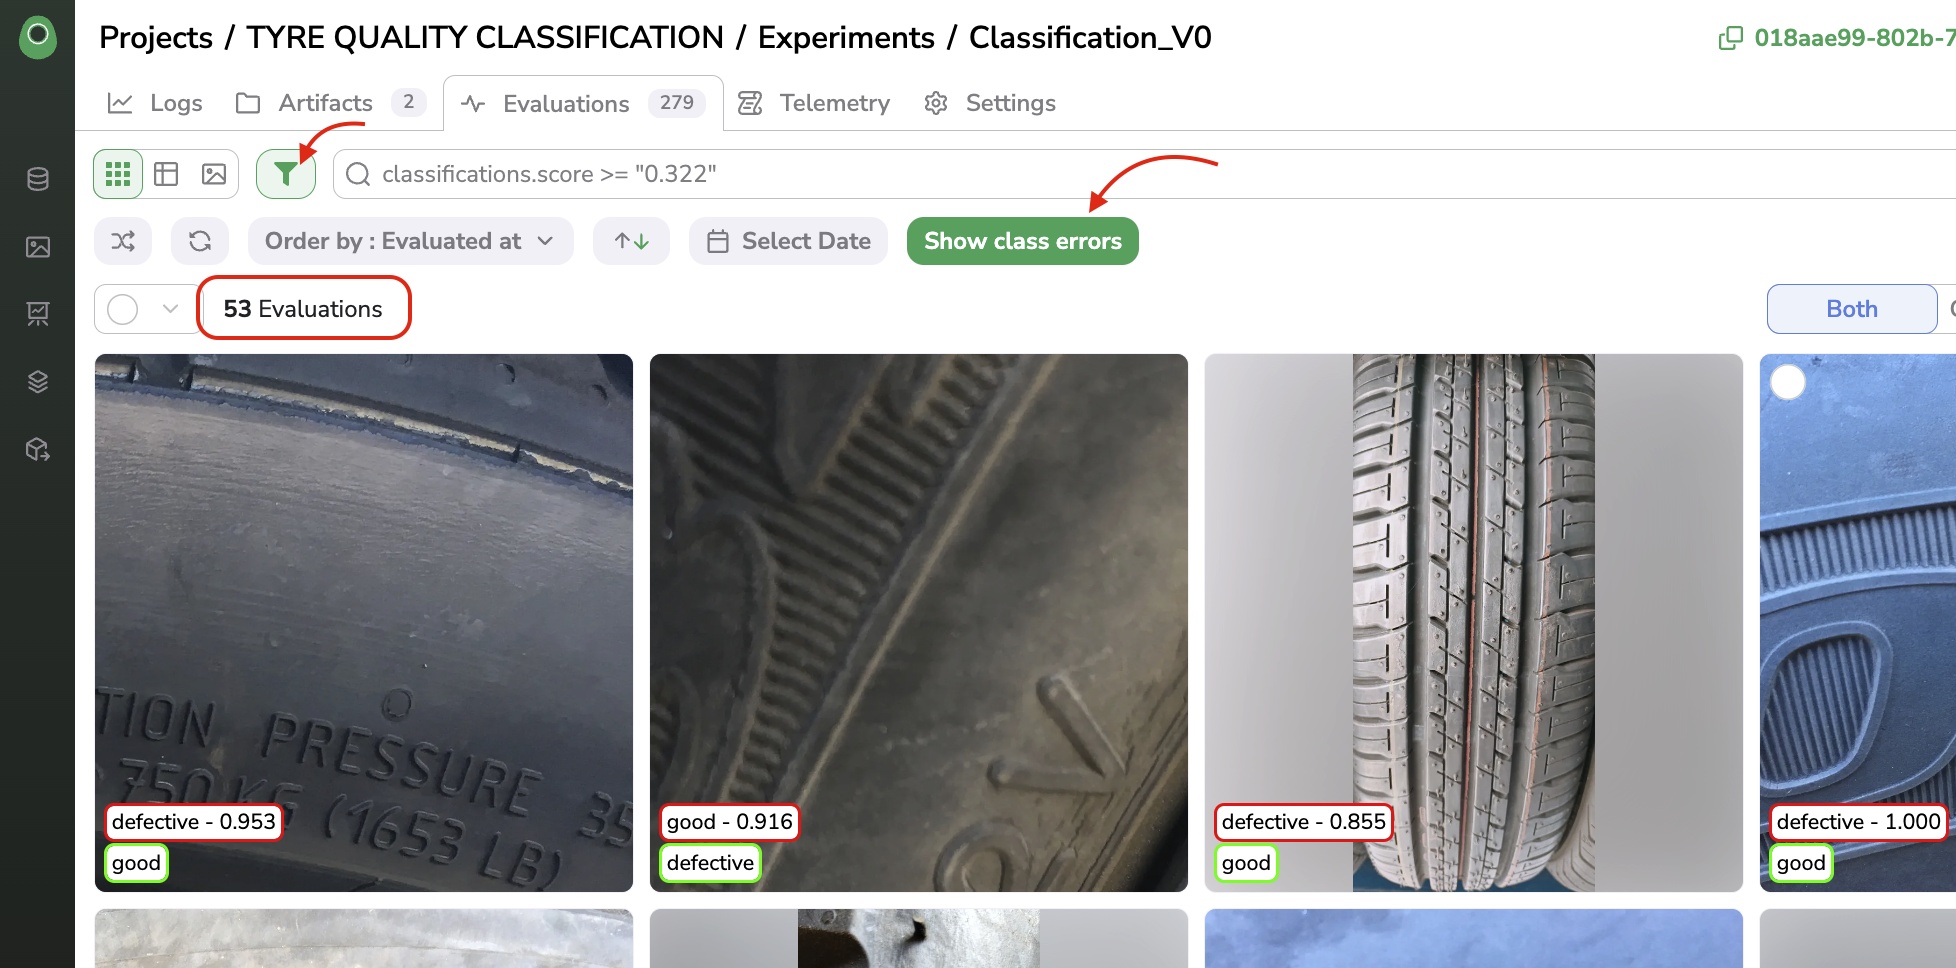
Show class errors
For instance, in the above screenshot, we can see that by using the Show class errors button, only the Evaluation with GroundTruth Label different from Predicted ones are displayed, in this case, we have 53 Evaluation out of 279 performed.
Updated about 1 year ago