Deployments - Predictions overview
The Predictions tab of a Deployment is a Data visualization view (such as the Asset overview for instance) that aims at letting users visualize easily all the PredictedAsset and related Prediction logged in the current Deployment.
To have the best user experience browsing among your PredictedAsset, once again Picsellia offers you three different views:
- Grid view
- Table view
- Details view
On each view, you can for sure filter and order PredcitedAsset the way you want.
1. PredictedAsset VS Data
PredictedAsset VS DataAs explained in the glossary, Data is an element of the Datalake that represents an image physically stored through a Storage Connector. While a PredcitedAsset is an element local to a Deployment, the same way an Asset is an element that is local to a DatasetVersion. By the way, Asset and PredictedAsset are two similar objects in terms of philosophy, structure, and way to use them.
However, a PredictedAsset is always related to a unique Data from the Datalake. This means that each time a PredictedAsset is logged in a Deployment, a Data is created in the Datalake, and the PredictedAsset that can be visualized in the Predictions tab of Deployment is actually linked to this freshly created Data. It also means that this Data can be used to be added in a DatasetVersion, so generating a new Asset
Basically, the Metadata of a PredictedAsset inherits from Data ones. But a PredictedAsset also has additional Metadata that is related to the Prediction.
It is important to know that a PredictedAsset usually has Prediction whereas Data can't.
2. Asset visualization
From the Predictions overview, you can switch from one view to another easily using the following button:
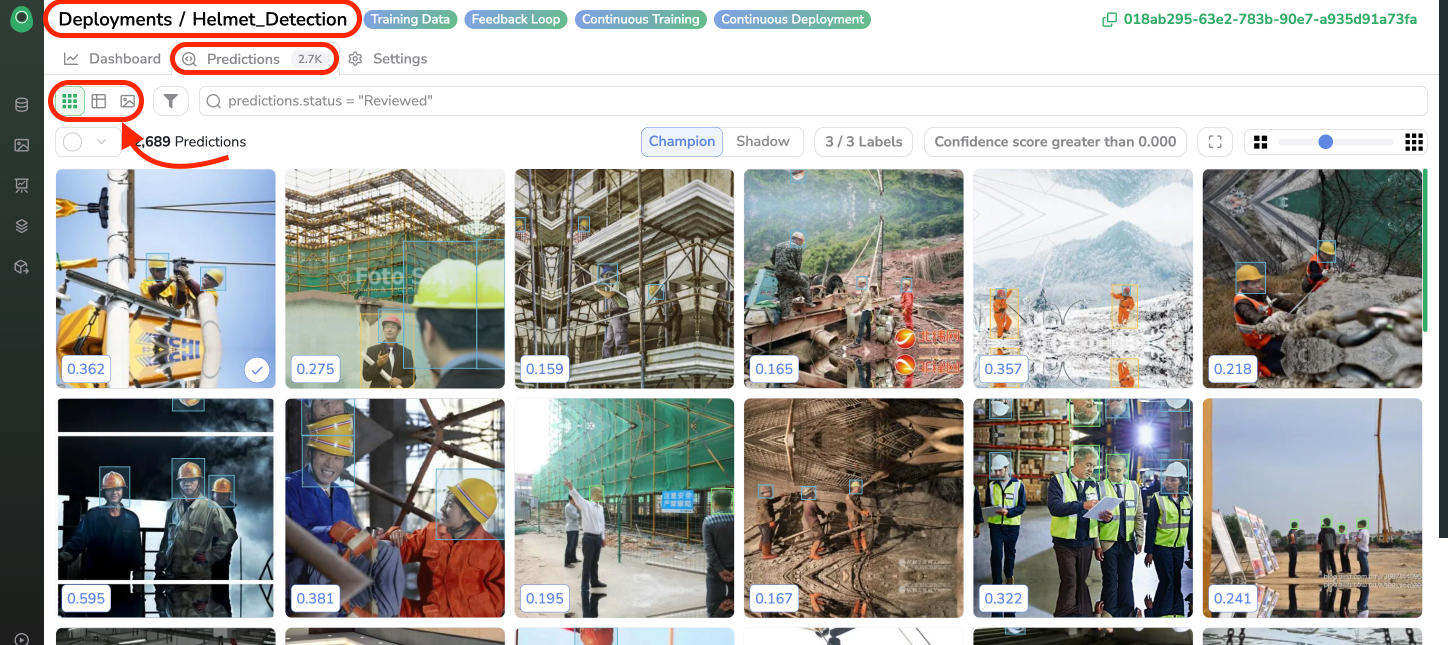
Predictions overviews
The header of the view indicates Deployment name.
Loading time optimizationFor any view, images thumbnails are generated to ensure a fluid navigation and reduce a much as possible loading times.
A. Visualize Predictions and related objects
Predictions and related objectsOn the Predictions overview, the potential Shape (Classification, Bounding-Boxes, or Polygons) contained in an Prediction related to a PredictedAsset are displayed.
If Prediction exist they can be visualized through the different views available in the Predictions overview.
AnPredictioncan only be related to aPredictedAsset, not toDataor anAsset.
B. Grid view
The Grid view allows visualizing at a glance many PredictedAsset logged in the Deployment.
You can play with the zoom to adjust the number of images displayed by row and change the aspect ratio (among Square, Landscape, Portrait, and 16:9), to adapt the visualization to the format of your image.
You can filter the Shape to display based on the Label or on the Confidence score.
For instance, hide all the Shape with the Label Person and a confidence score lower than 0.6.
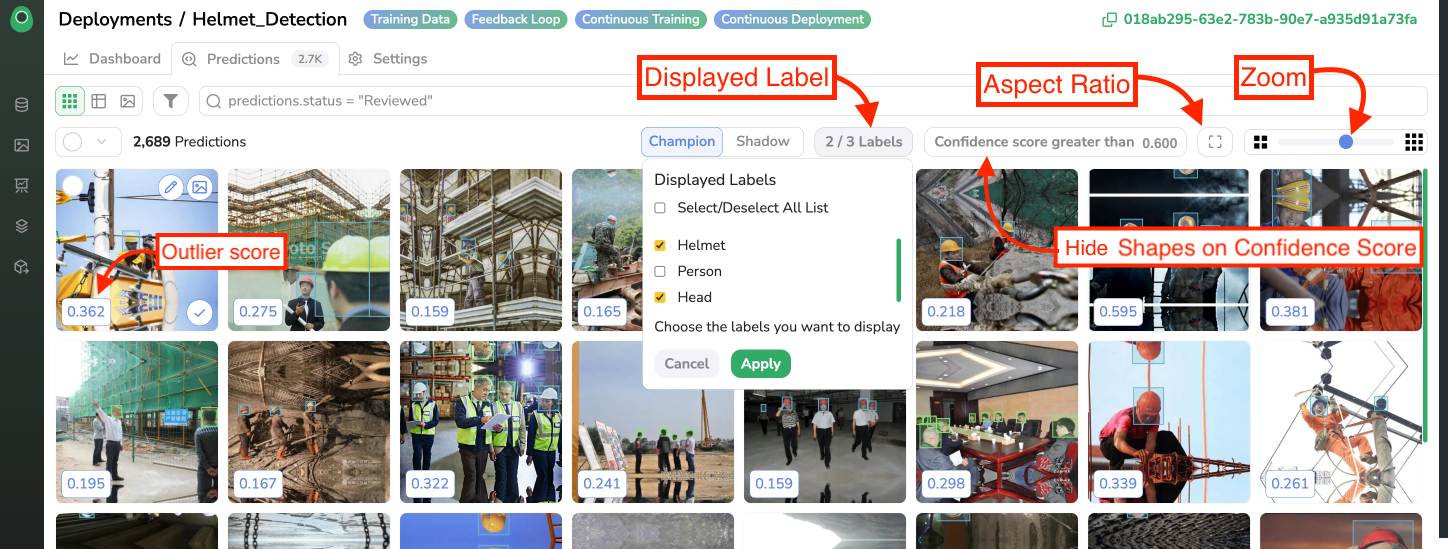
Grid view
For each PredictedAsset displayed in the Grid view, a score is displayed in the bottom-left corner of the thumbnail, this score is the Outlier score of the PredictedAsset as detailed here.
As explained here, each PredictedAsset can have two Prediction related. The regular Champion Prediction and a potential Shadow Prediction. In case of a Shadow Prediciton existing, you can choose the one to be displayed using the radio button Champion / Shadow as shown below:
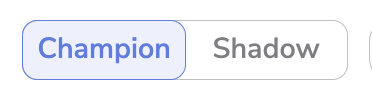
Switch between Champion / Shadow Prediction
Switch to Details view or annotateHovering on any image will display one badge allowing to vizualize the
PredictedAssetin the Details view and one allowing to open the Predcition Review tool (pen icon)
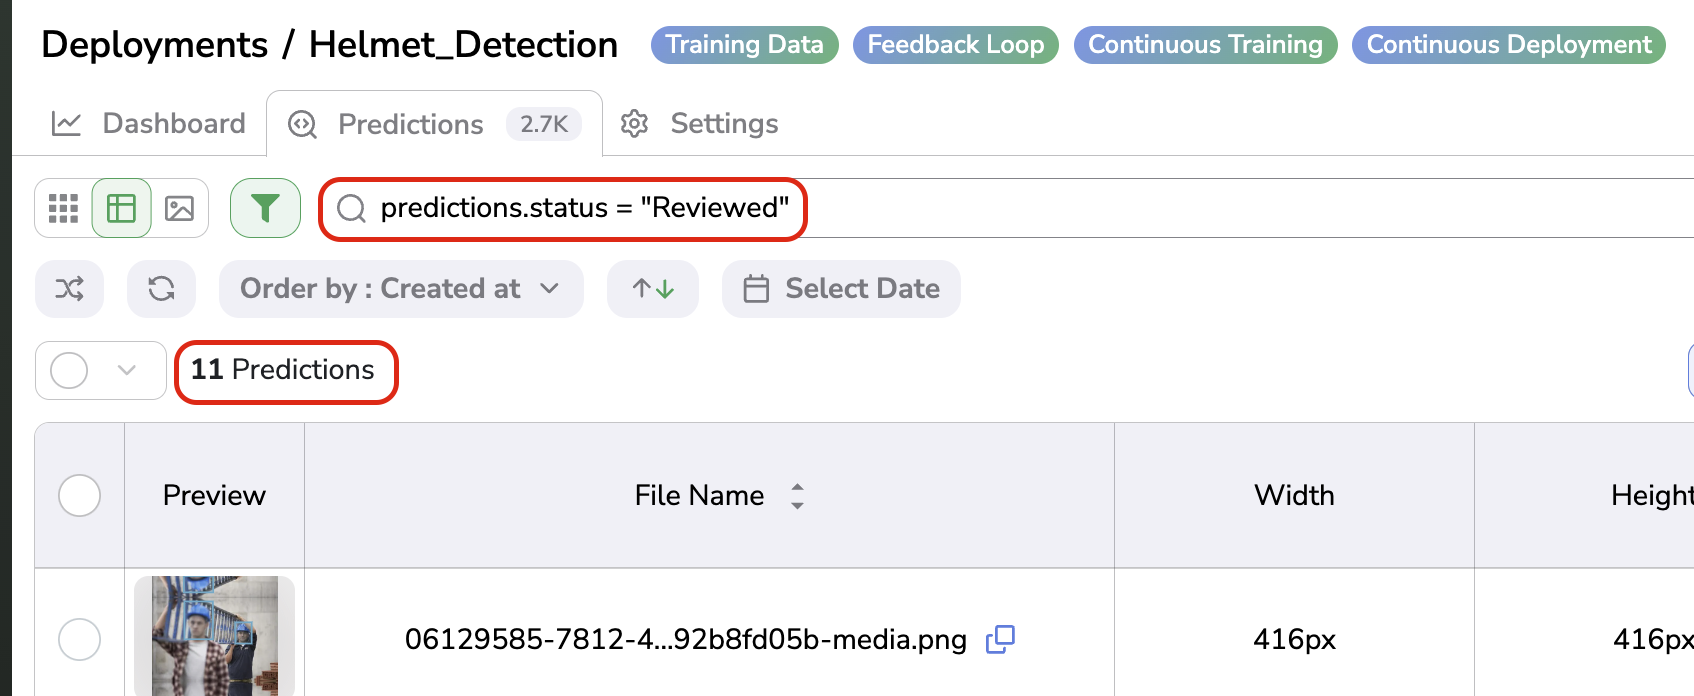
C. Table view
The Table view mainly focuses on visualizing all the Metadata associated with PredictedAsset and Prediction logged in the Deployment.
Please note that the displayed Metadata is related to the PredictedAsset, not to the linked Data. You can also notice that Prediction Metadata is available.
In addition of the regular Metadata (such as Filename, Width, Heigh, Creation Date), are displayed the Outlier Score of each PredictedAsset, the status in the human review workflow and the number of Shape for the Champion & Shadow Prediciton:
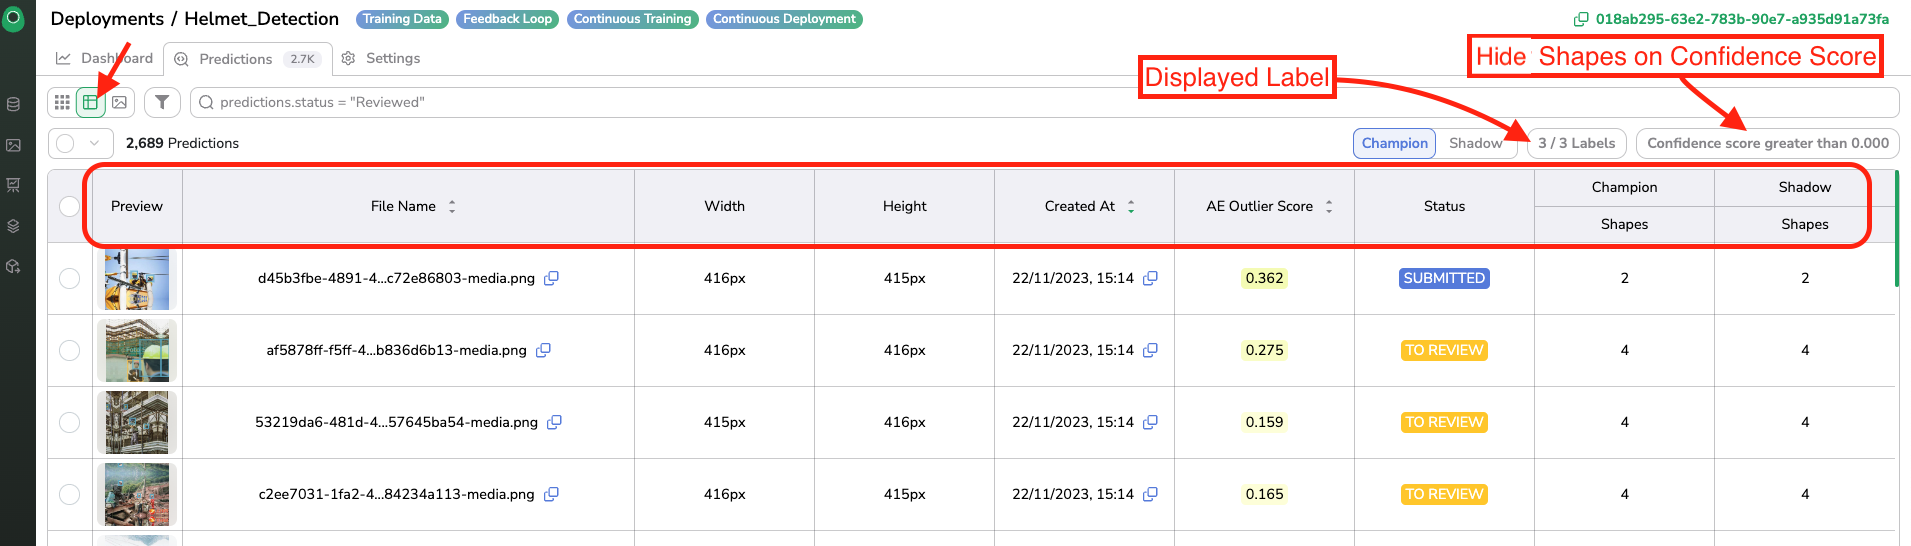
Table view
Switch to Details viewClicking on any image Preview will switch to the Details view of this image.
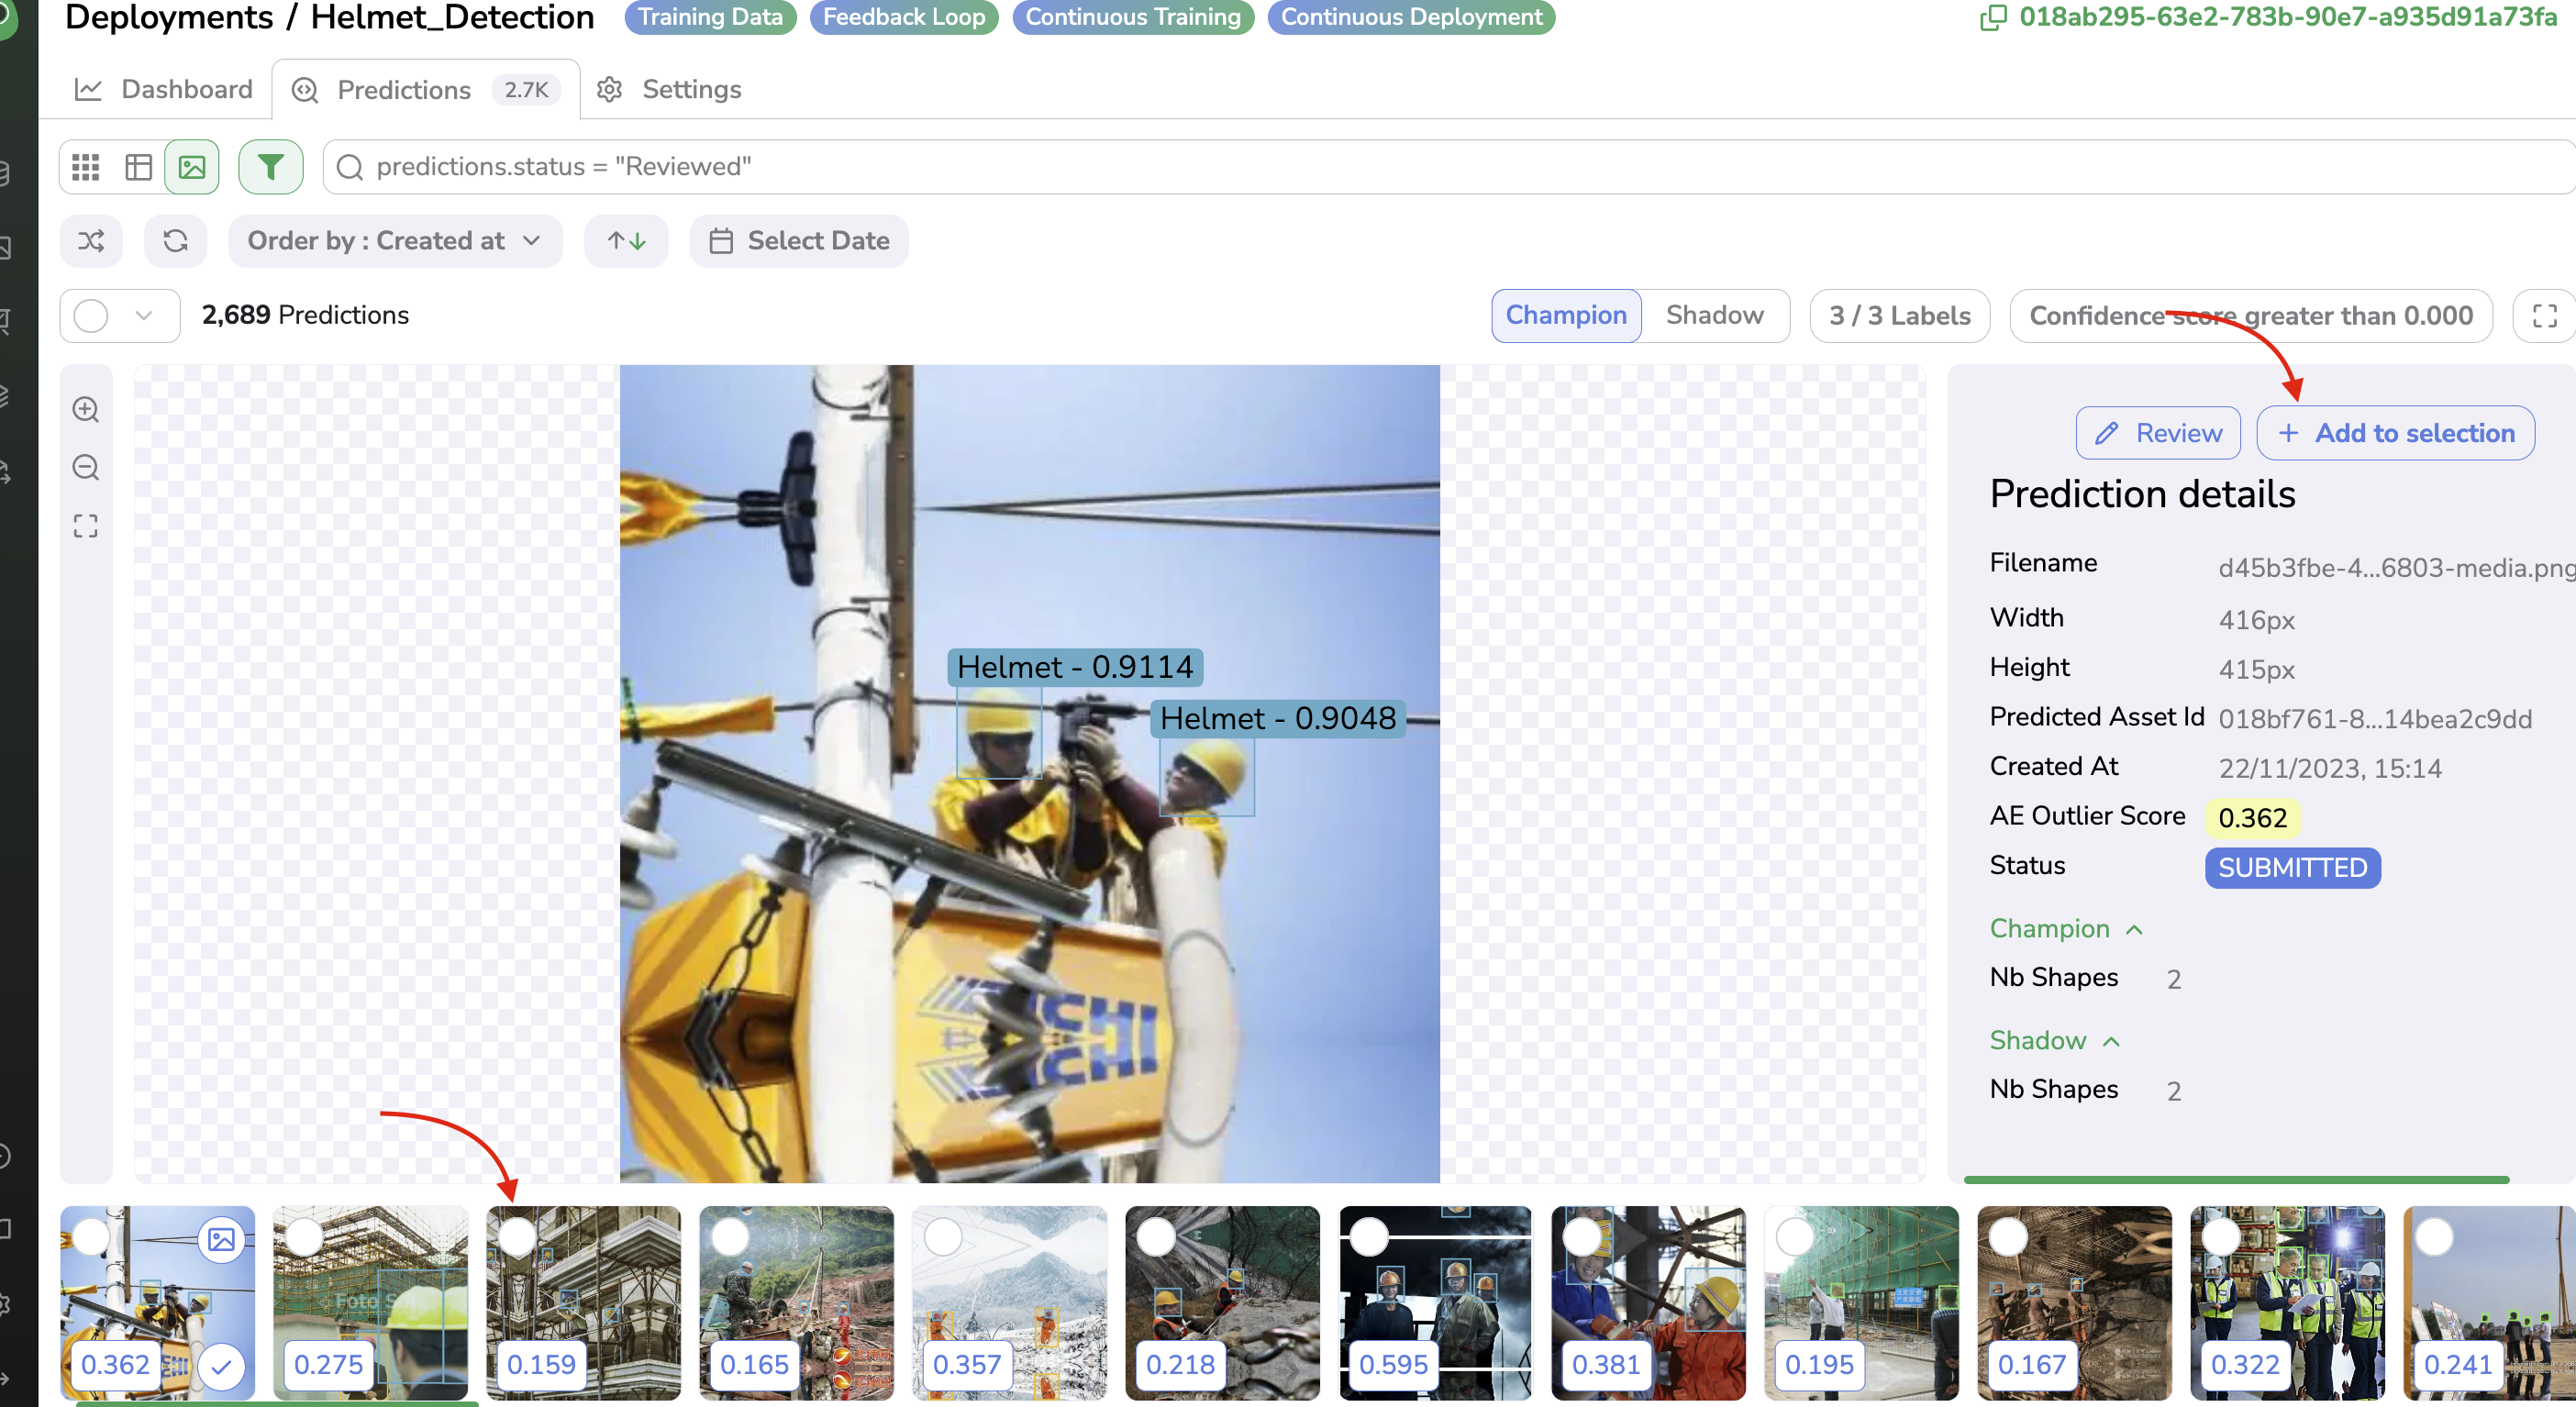
D. Details view
The Details view aims to display all the elements from one particular PredictedAsset and associated Prediction logged in the current Deployment.
As for the Grid view, the aspect ratio can be chosen among Square, Landscape, Portrait, and 16:9. You will also be able to zoom in/out on the displayed image, switch from Champion Prediciton to Shadow Prediction,and select the Shape to display based on the Label or the Confidence Score.
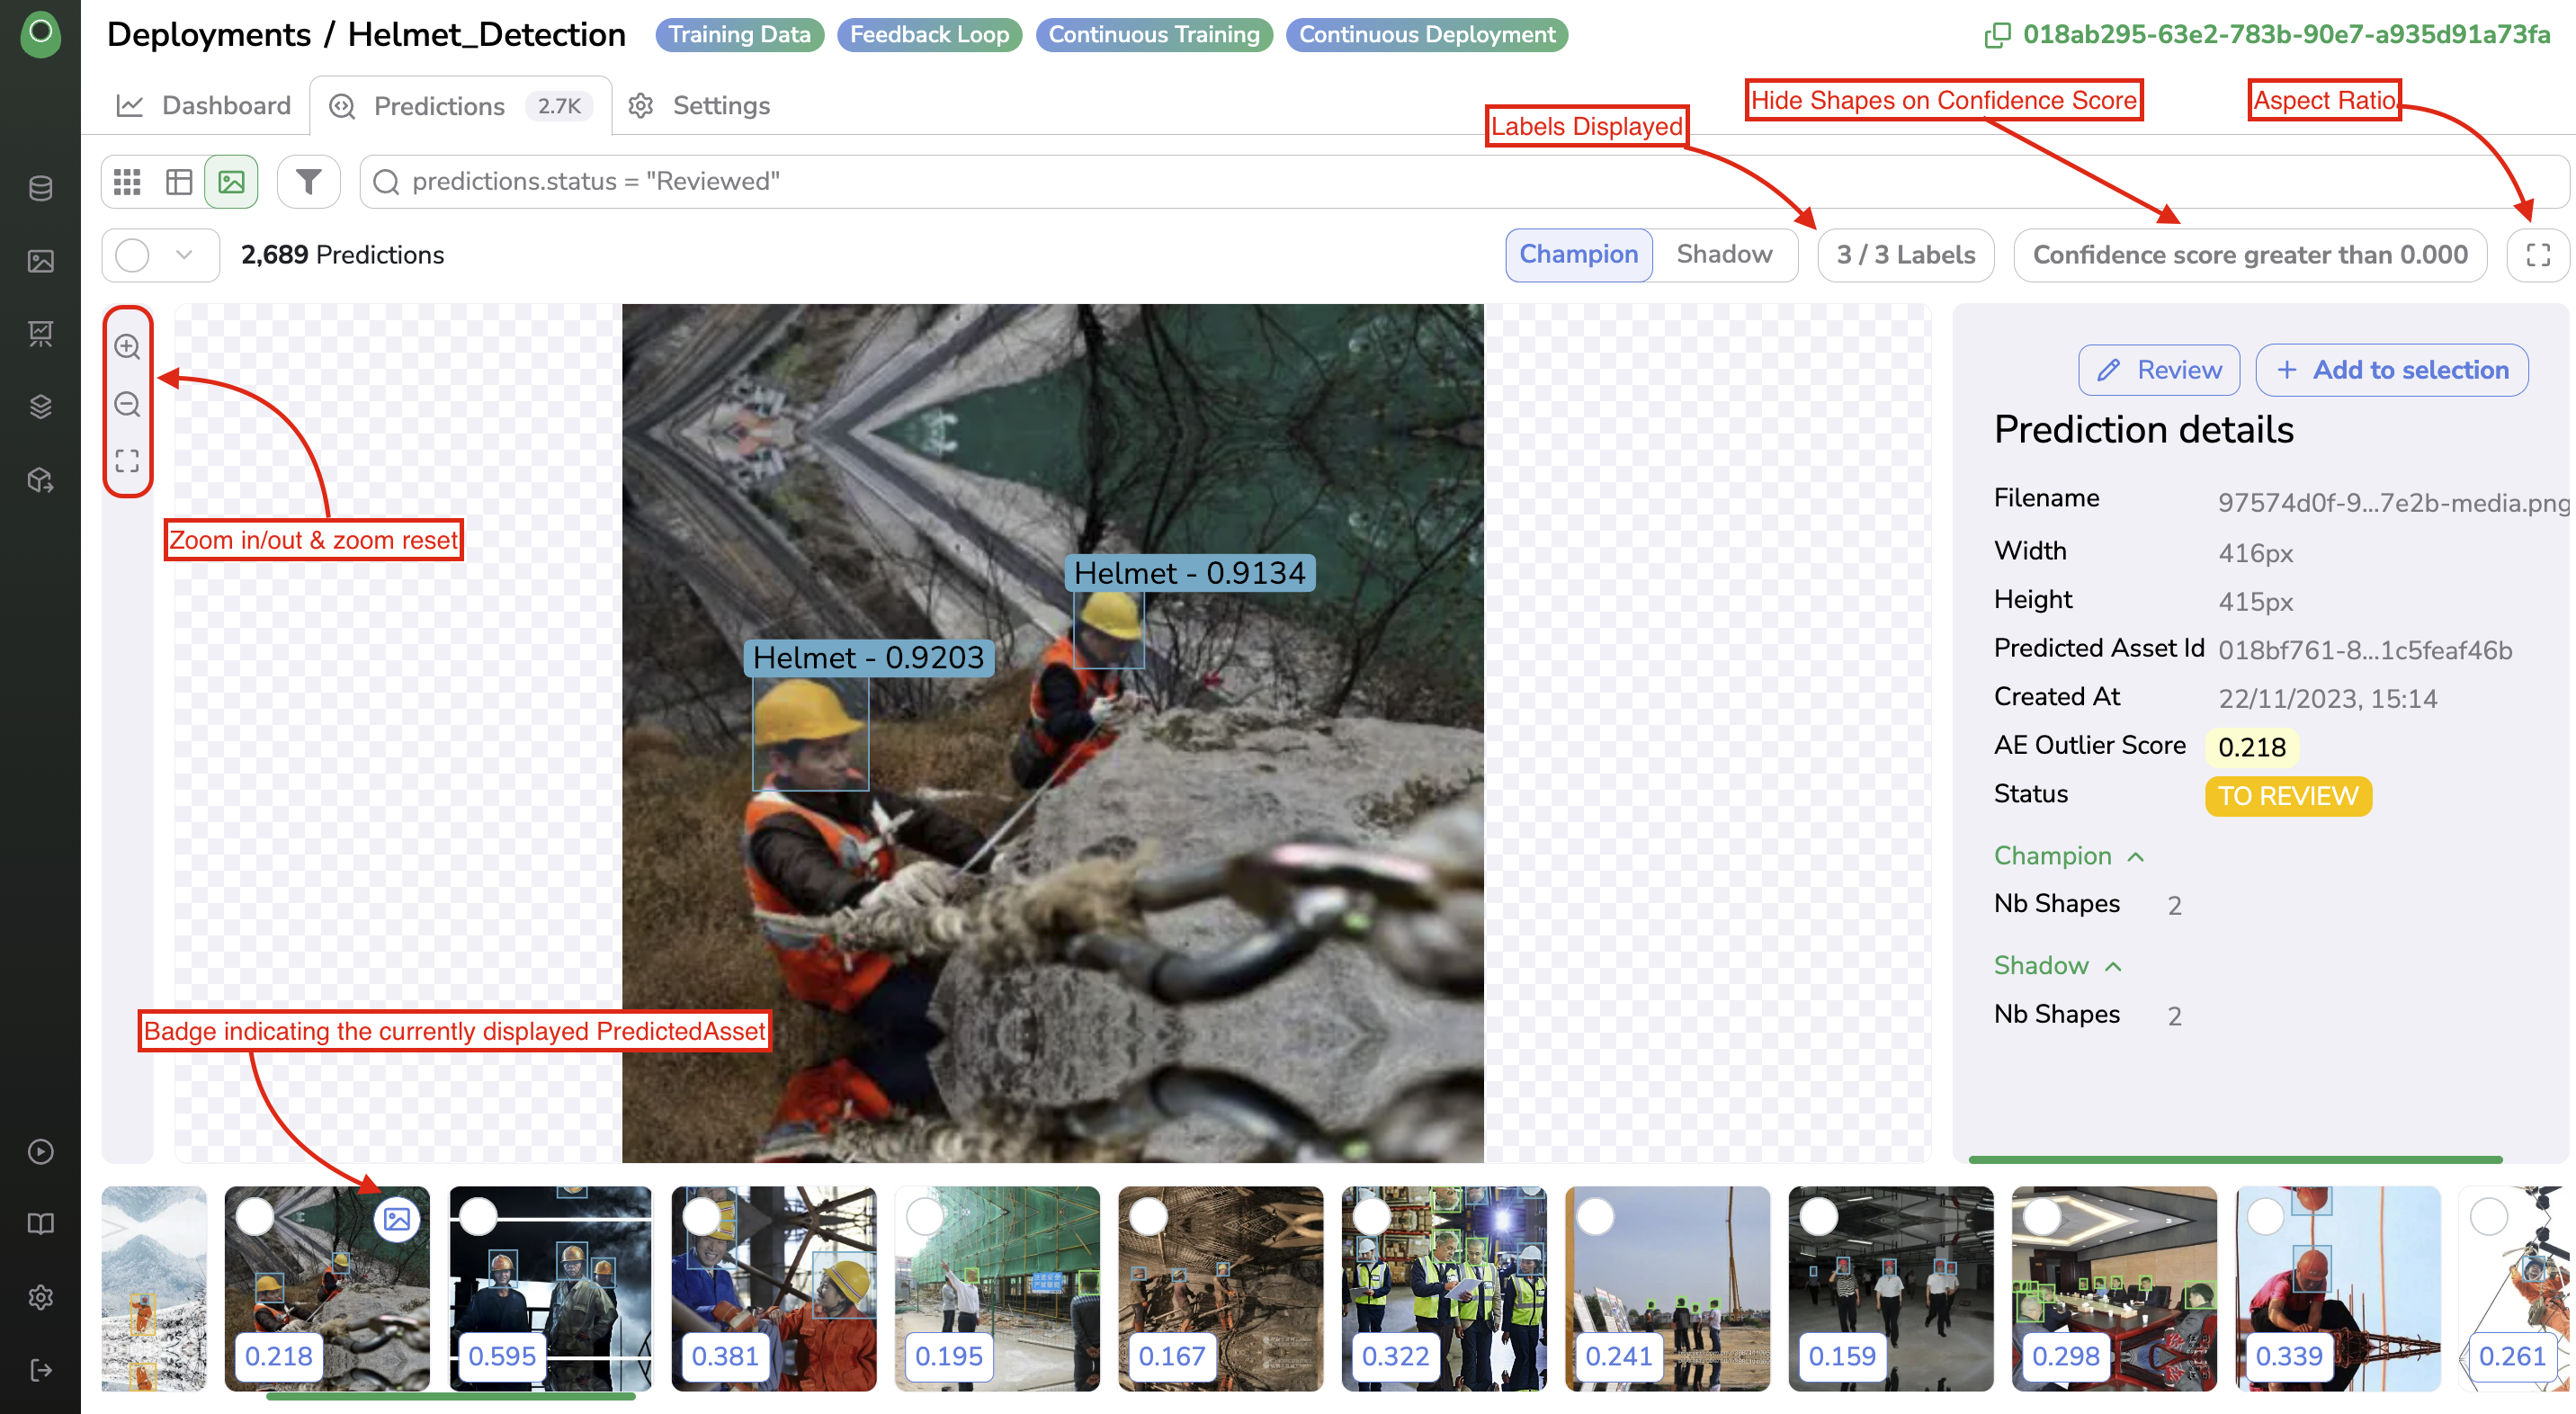
Details view
At the bottom of the view, the image gallery displays the thumbnails of the previous/next PredictedAsset logged in the current Deployment.
Metadata related to the PredictedAsset and Prediction are displayed on the right side of the view.
For each PredictedAsset displayed in the Thumbnail gallery at the bottom of the view, a score is displayed in the bottom-left corner of each thumbnail, this score is the Outlier score of the PredictedAsset as detailed here. The Outlier score of the currently displayed PredictedAsset is available in the Metadata information on the right panel.
Left/right arrow keys allows a smooth navigation across images
3. PredictedAsset ordering
PredictedAsset orderingFrom any Prediction overview, you can select the sorting button to access more sorting possibilities.
Open ordering features
The sorting features are then displayed. You can sort the PredictedAsset displayed:
- Randomly
- By Asset Creation Date (ascendant or descendant)
- By File Name (ascendant or descendant)
- By Outlier score
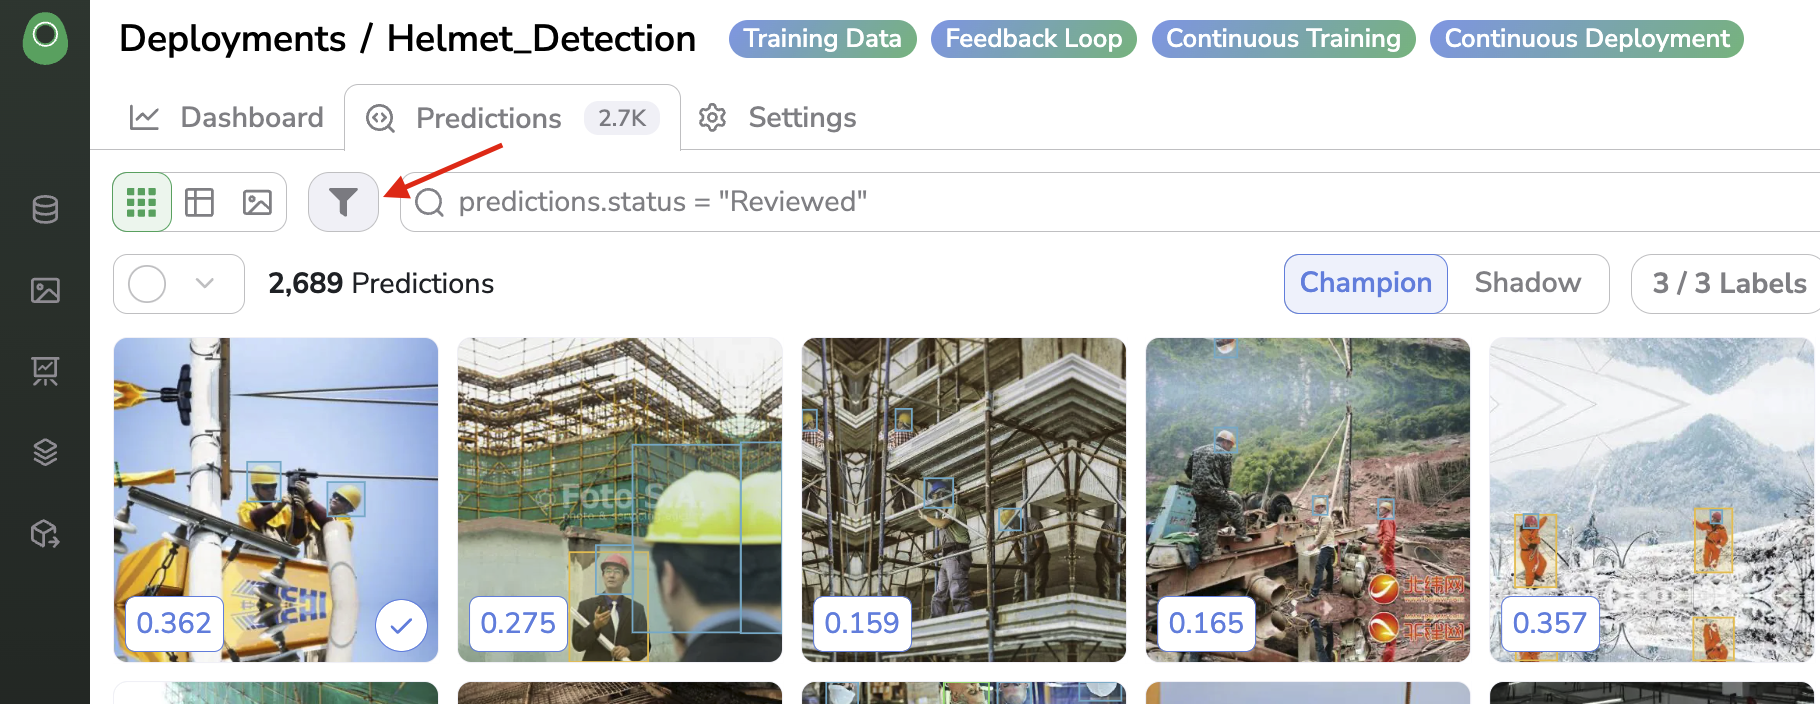
4. PredictedAsset filtering
PredictedAsset filteringIn addition to ordering PredictedAsset, you can use the SearchBar available in any Prediction overview to filter for PredcitedAsset on particular criteria such as Status, number of Shape in the Prediction for instance. To leverage the SearchBar properly you need to create queries with a dedicated syntax called QueryLangage, it is also used in the Data overview or Asset overview so you can rely on this documentation page for further details on the QueryLangage.
Once the query is prompted in the SearchBar, the number of PredictedAsset that satisfies this query and the associated Thumbnails will be displayed in the overview.
Use of the SearchBar
You also have the possibility to filter on PredictedAsset displayed based on the Creation Date, to do so you can use the Date picker as shown below:
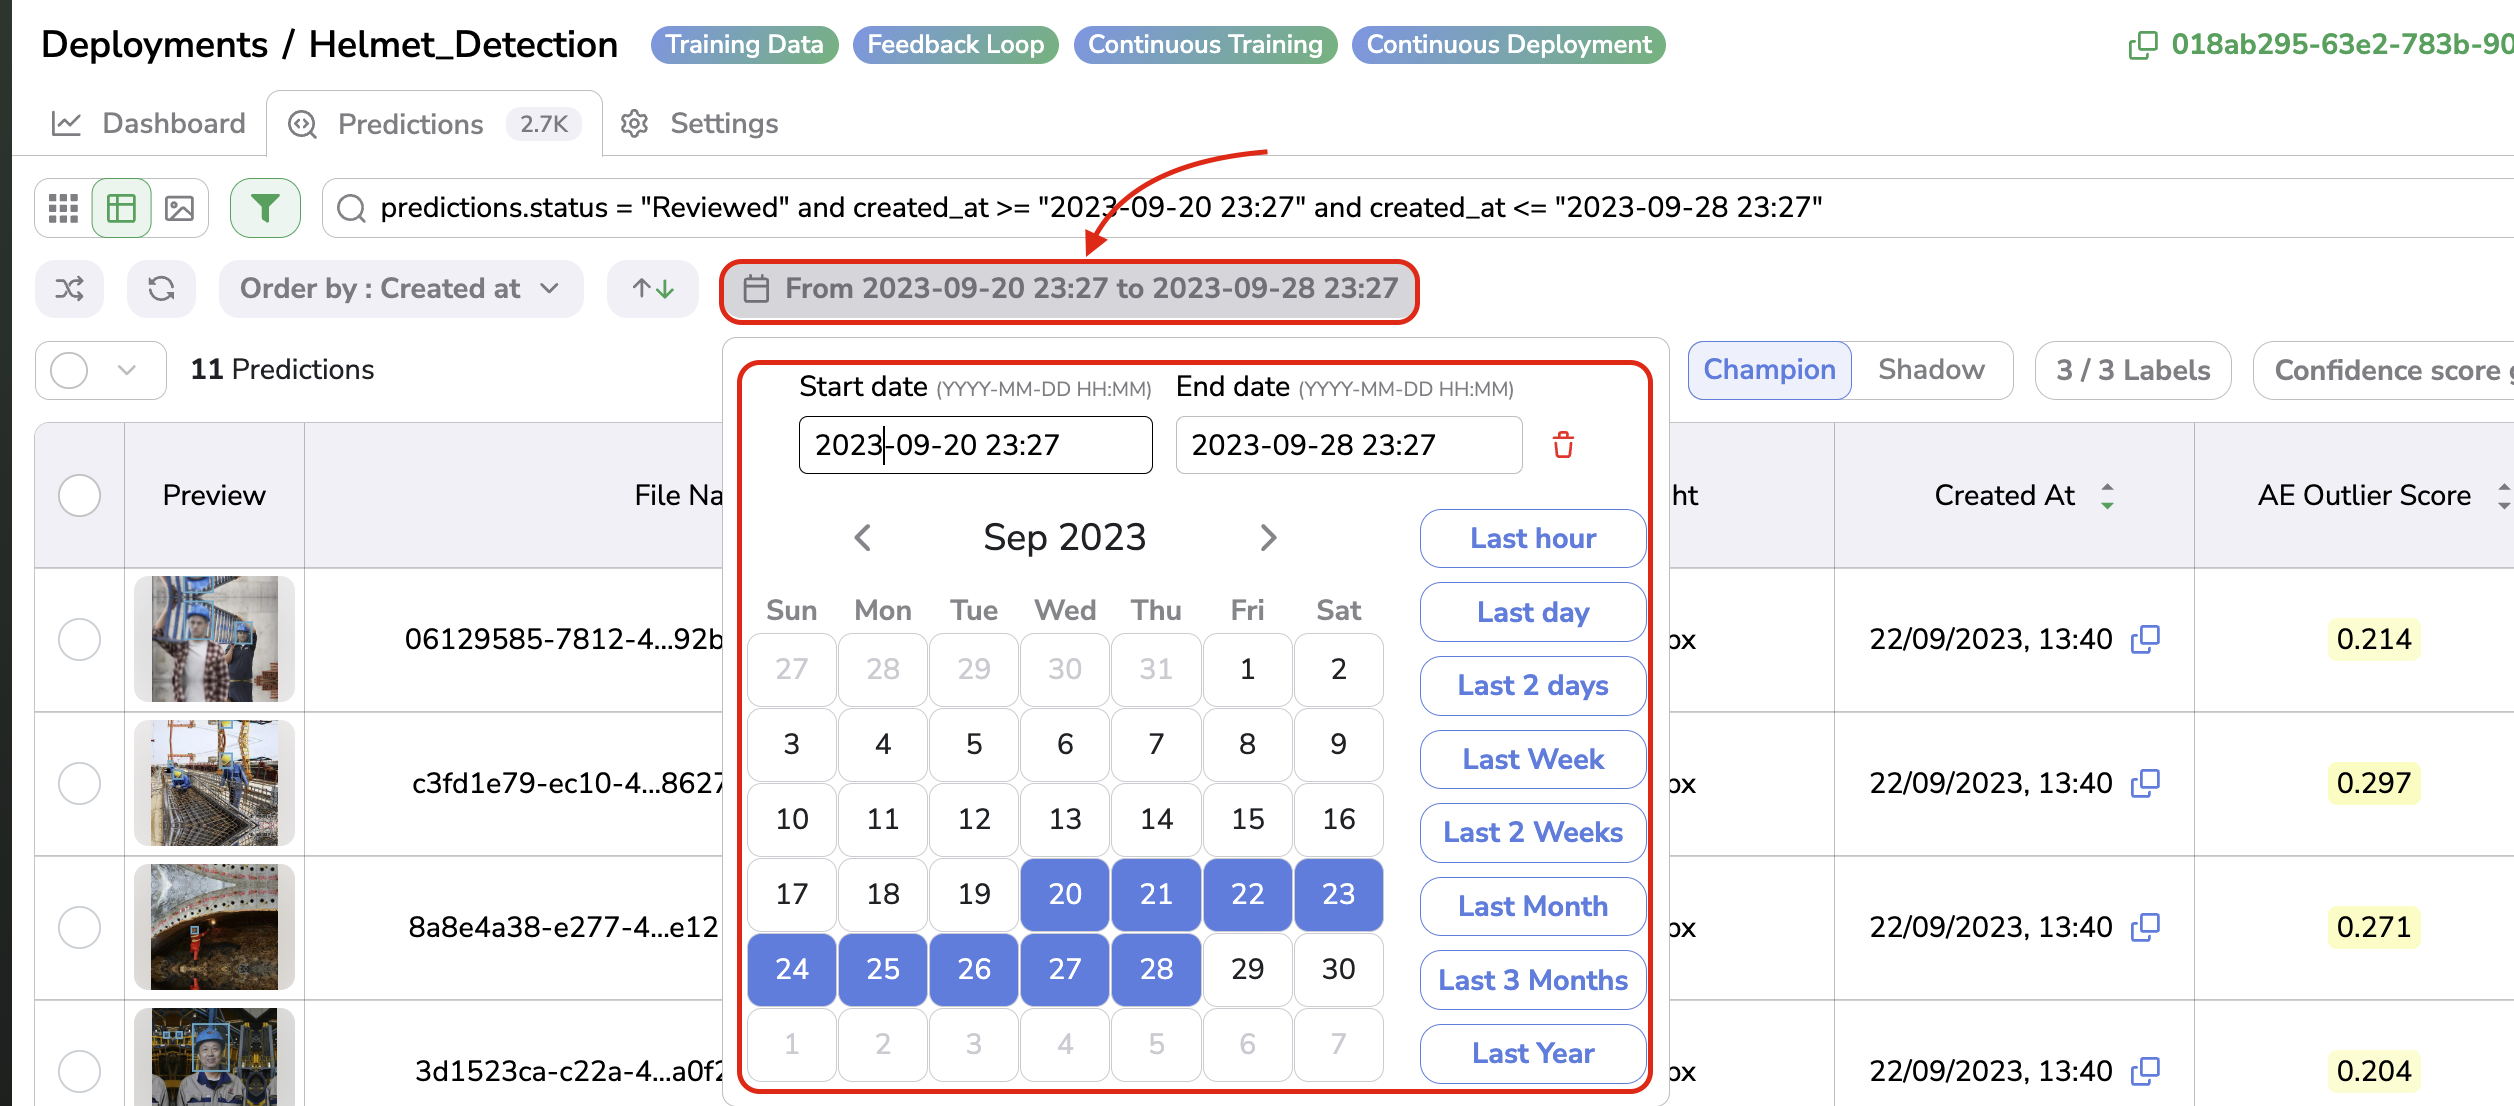
Date picker
5. PredictedAsset selection
PredictedAsset selectionNow that we are able to visualize, sort, and filter all the PredictedAsset from the current Deployment. We will see how to select one or many of them to perform further action on them.
From any Prediction overview, the selection of PredictedAsset can be done:
1 - Manually by checking the tickbox on each PredictedAsset (tickbox available on all views and Add to selection button available in Details view)
Manual Assetselection
2 - By selecting all or the x first displayed PredictedAsset in the current overview:
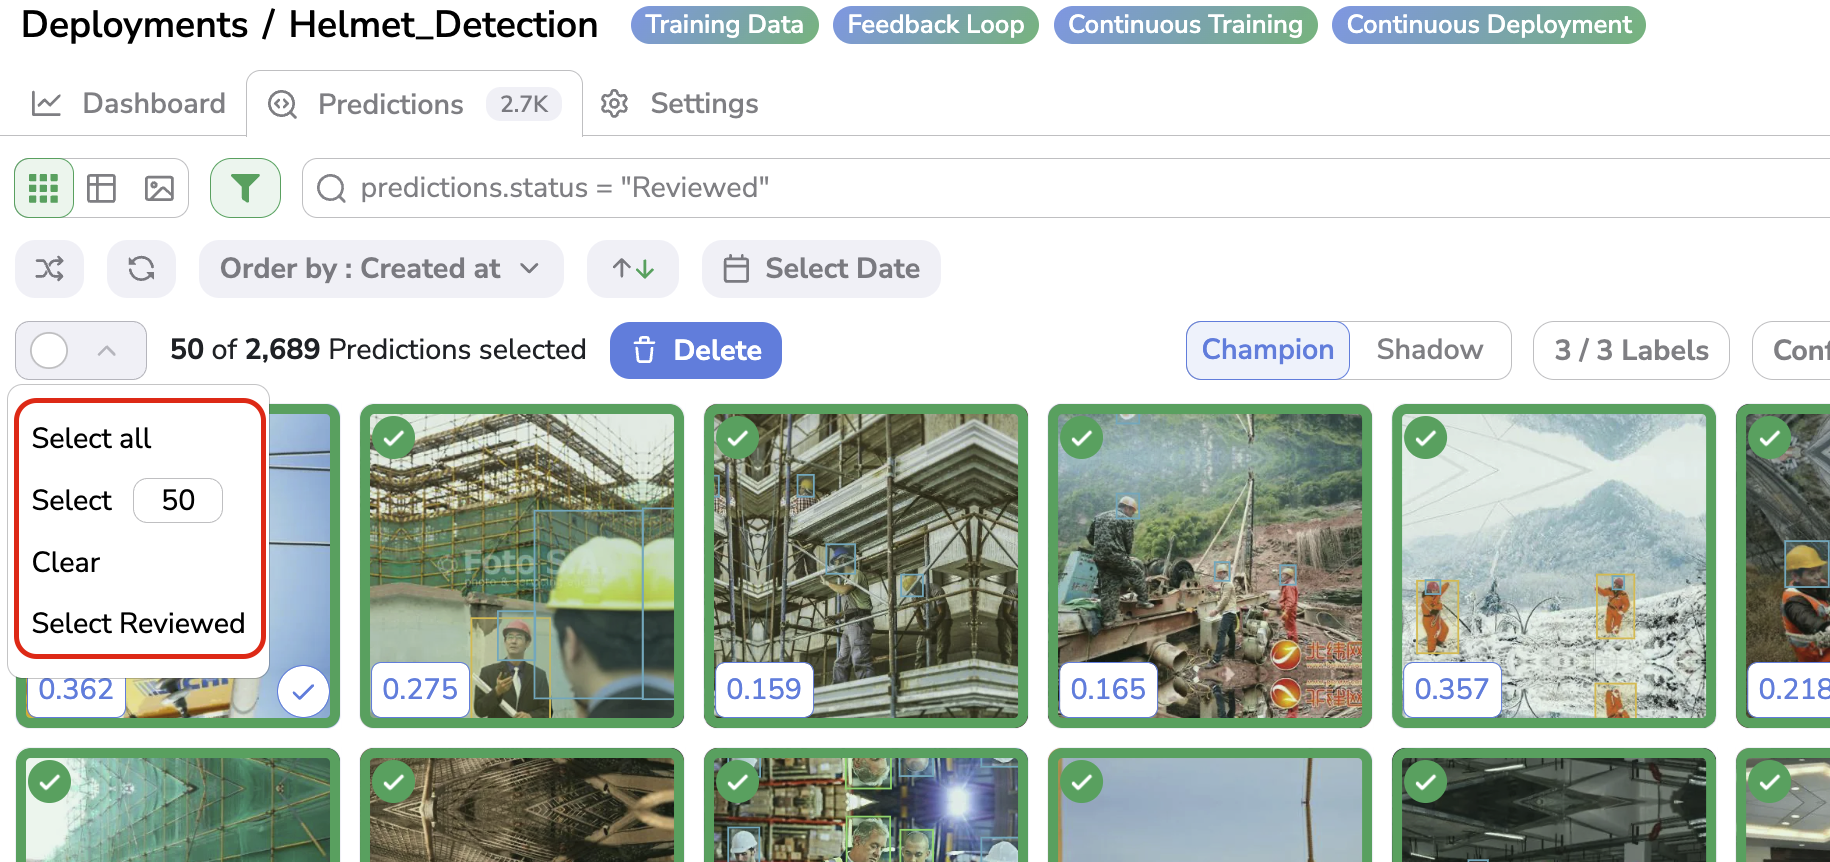
Select Reviewed optionThe Select Reviewed option allows you to automatically select all the
PredictedAssetthat are in Reviewed status. More details on the human review workflow are available here.
The number of selected PredictedAsset against the total number of PredictedAsset currently displayed/filtered in the Deployment is displayed here:
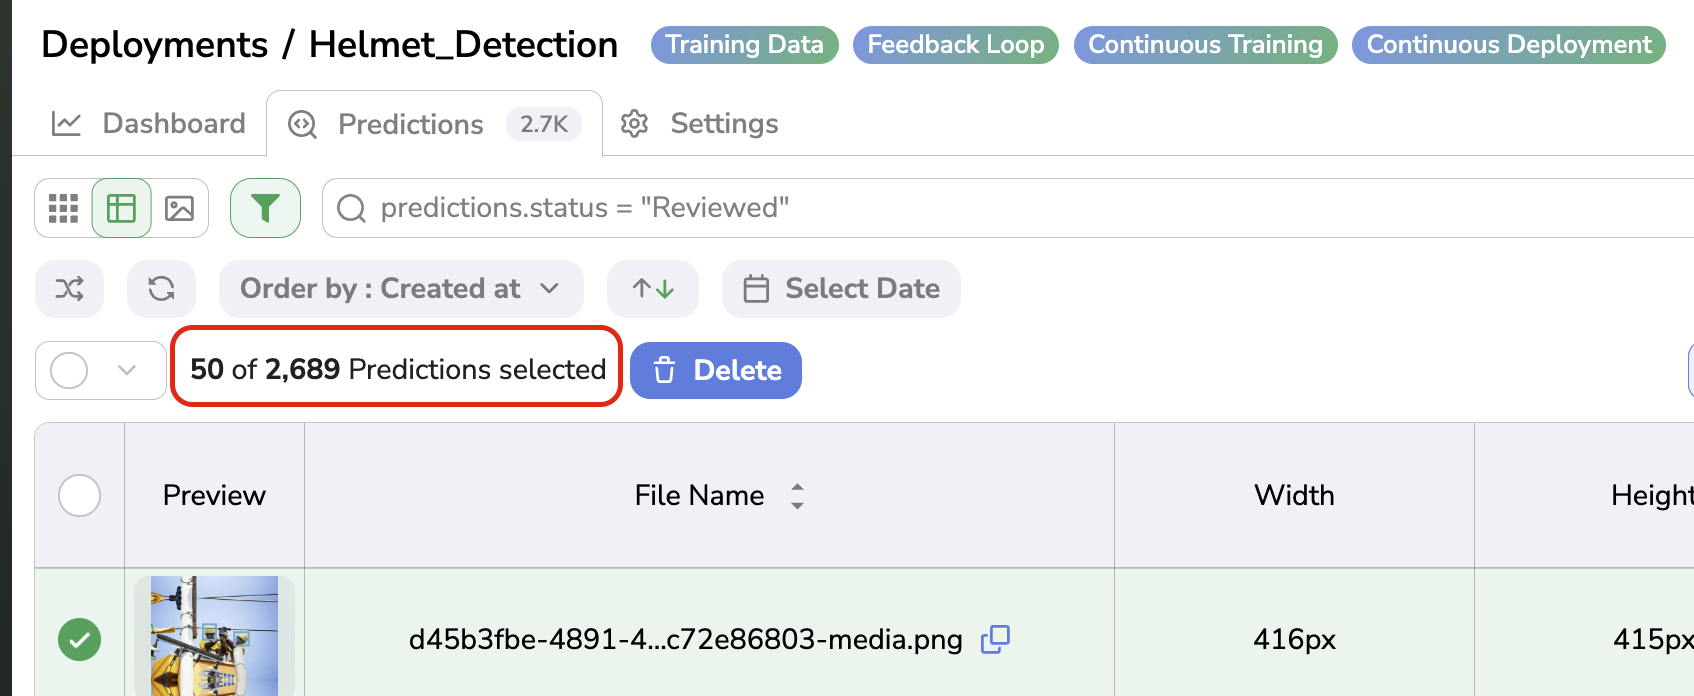
Selected Asset
OncePredictedAssetare selected, action buttons are displayed.
6. PredictedAsset deletion
PredictedAsset deletionTo delete a PredictedAsset from a Deployment, you need to select the to-be-deleted PredictedAssetand click on Delete :
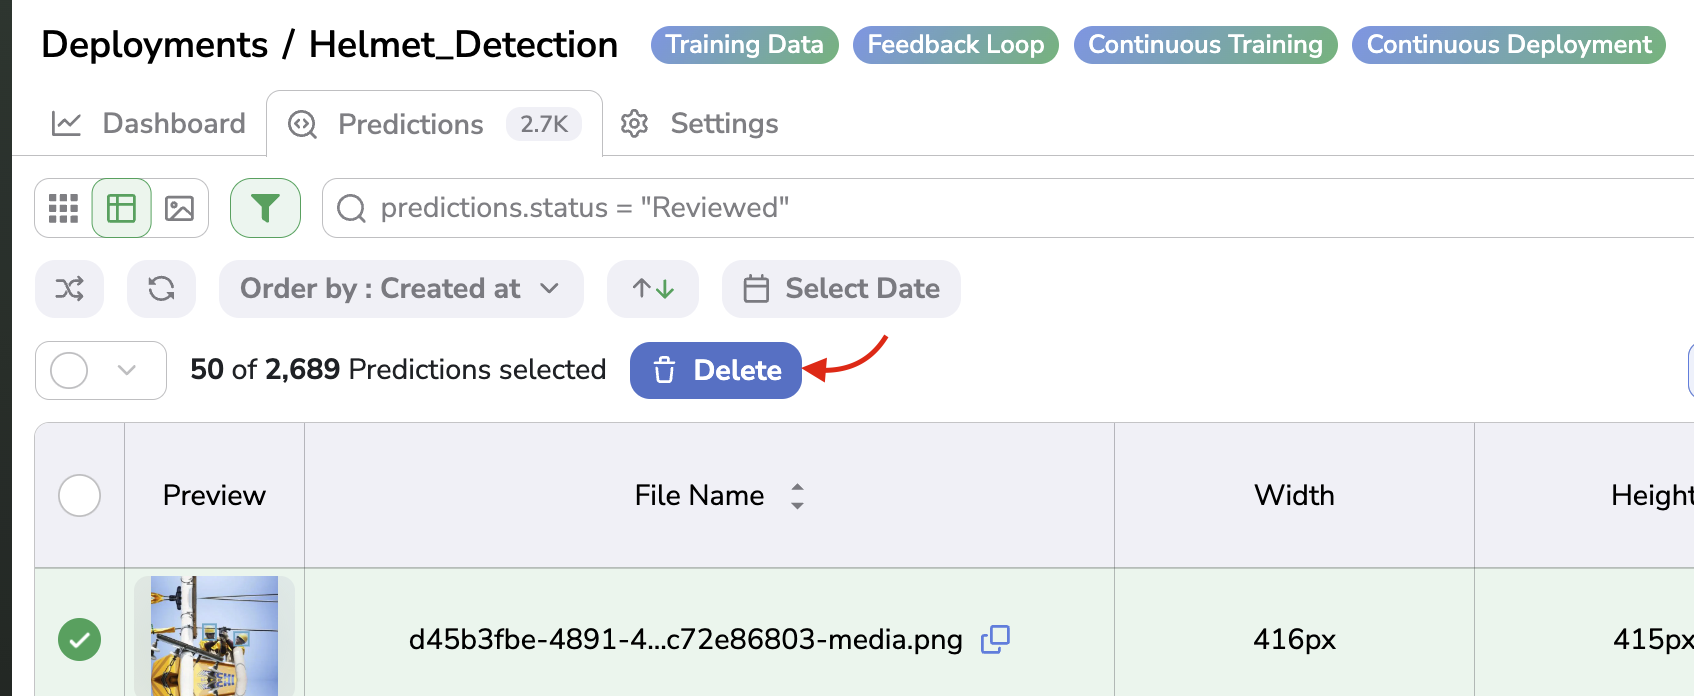
Assetdeletion
Deleting aPredictedAssetonly delete it from the currentDeploymentIt means that the linked
Dataremains in theDatalakeand that any potential otherAssetlinked to the sameDatawill also remains in theirDatasetVersion. So to delete permanantly aPredictedAssetfrom Picsellia, you need to delete it from theDatalake
Updated about 1 year ago