

Comparison
The purpose of any Project on Picsellia is to give you an AI Lab in which you can perform several Experiment, evaluate their performance, and select the best one to create the most performing ModelVersion. Aggregate metrics rarely tell the whole story: two Experiment can post nearly identical scores while failing on very different kinds of images, and a gap that looks small on a chart can hide the handful of edge cases that matter most for your use case. To let you select an Experiment with confidence, Picsellia lets you compare them from both angles: on their Logs, to see which one trained better on aggregate, and on their Evaluation, to see exactly how their predictions differ, Asset by Asset, on your own test set.
1. Compare Logs
The comparison of Experiment starts in the Project overview, more precisely in the Experiments tab.
From this view, you can select two or more Experiment to compare and click on the Compare logs button.
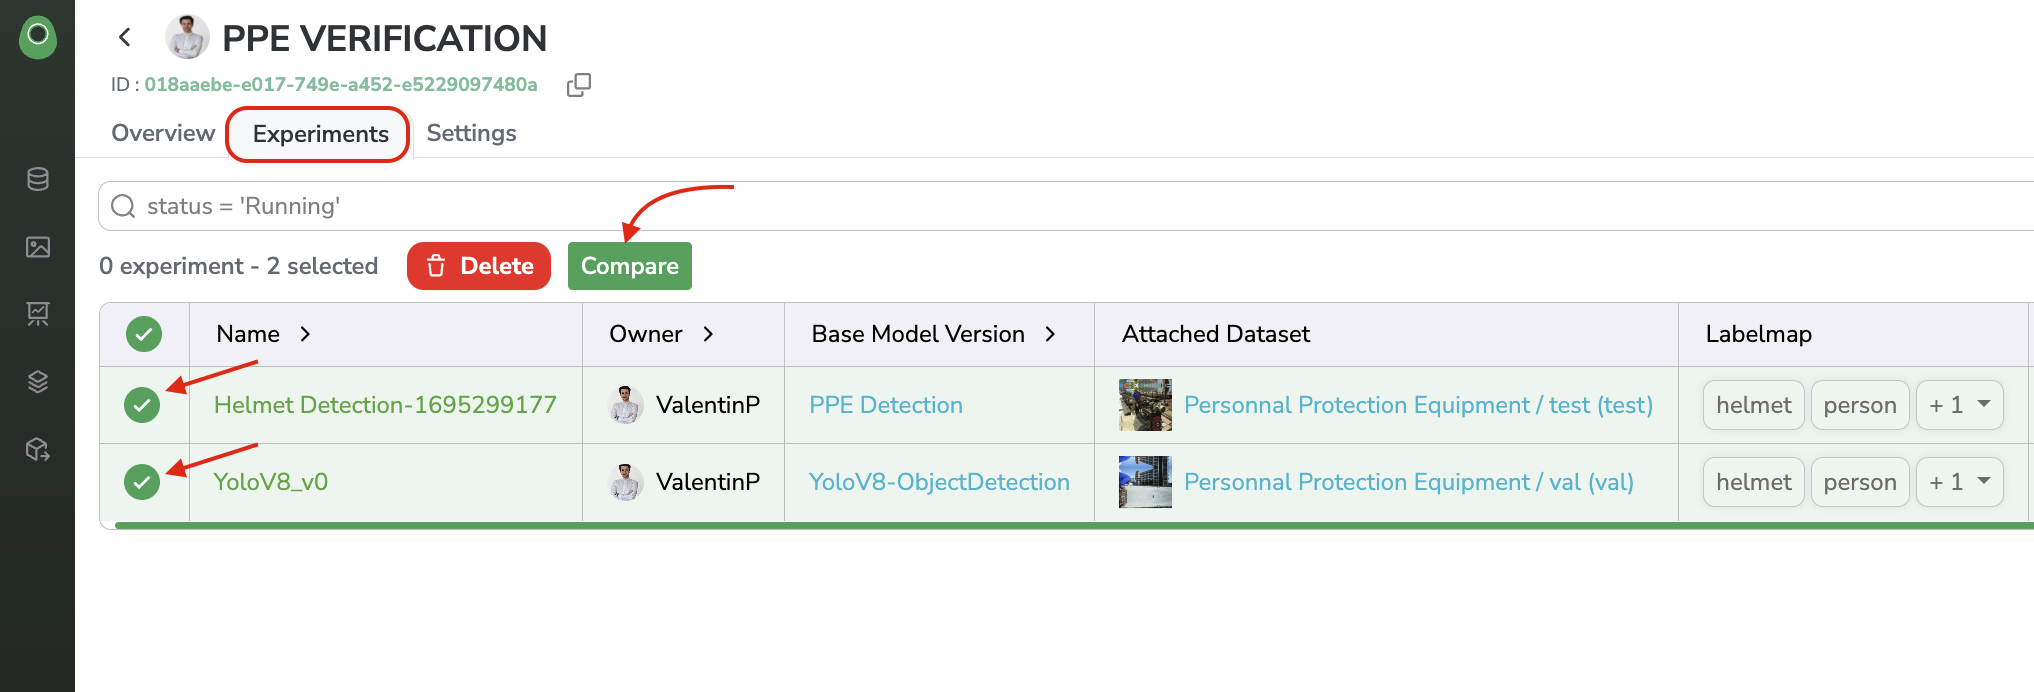
Experiment selection for comparison
The Comparison view will then open. This view puts side-by-side each Metric available in the Logs tab of the selected Experiment.
To ensure the consistency of the comparison, you can only compare Metrics that share the same Metric type and the same Metric name — this way you're sure you're not comparing, for instance, a loss with a recall.
In the screenshot below, one Metric of type Line and name val_cls_loss is shared by the two compared Experiment.
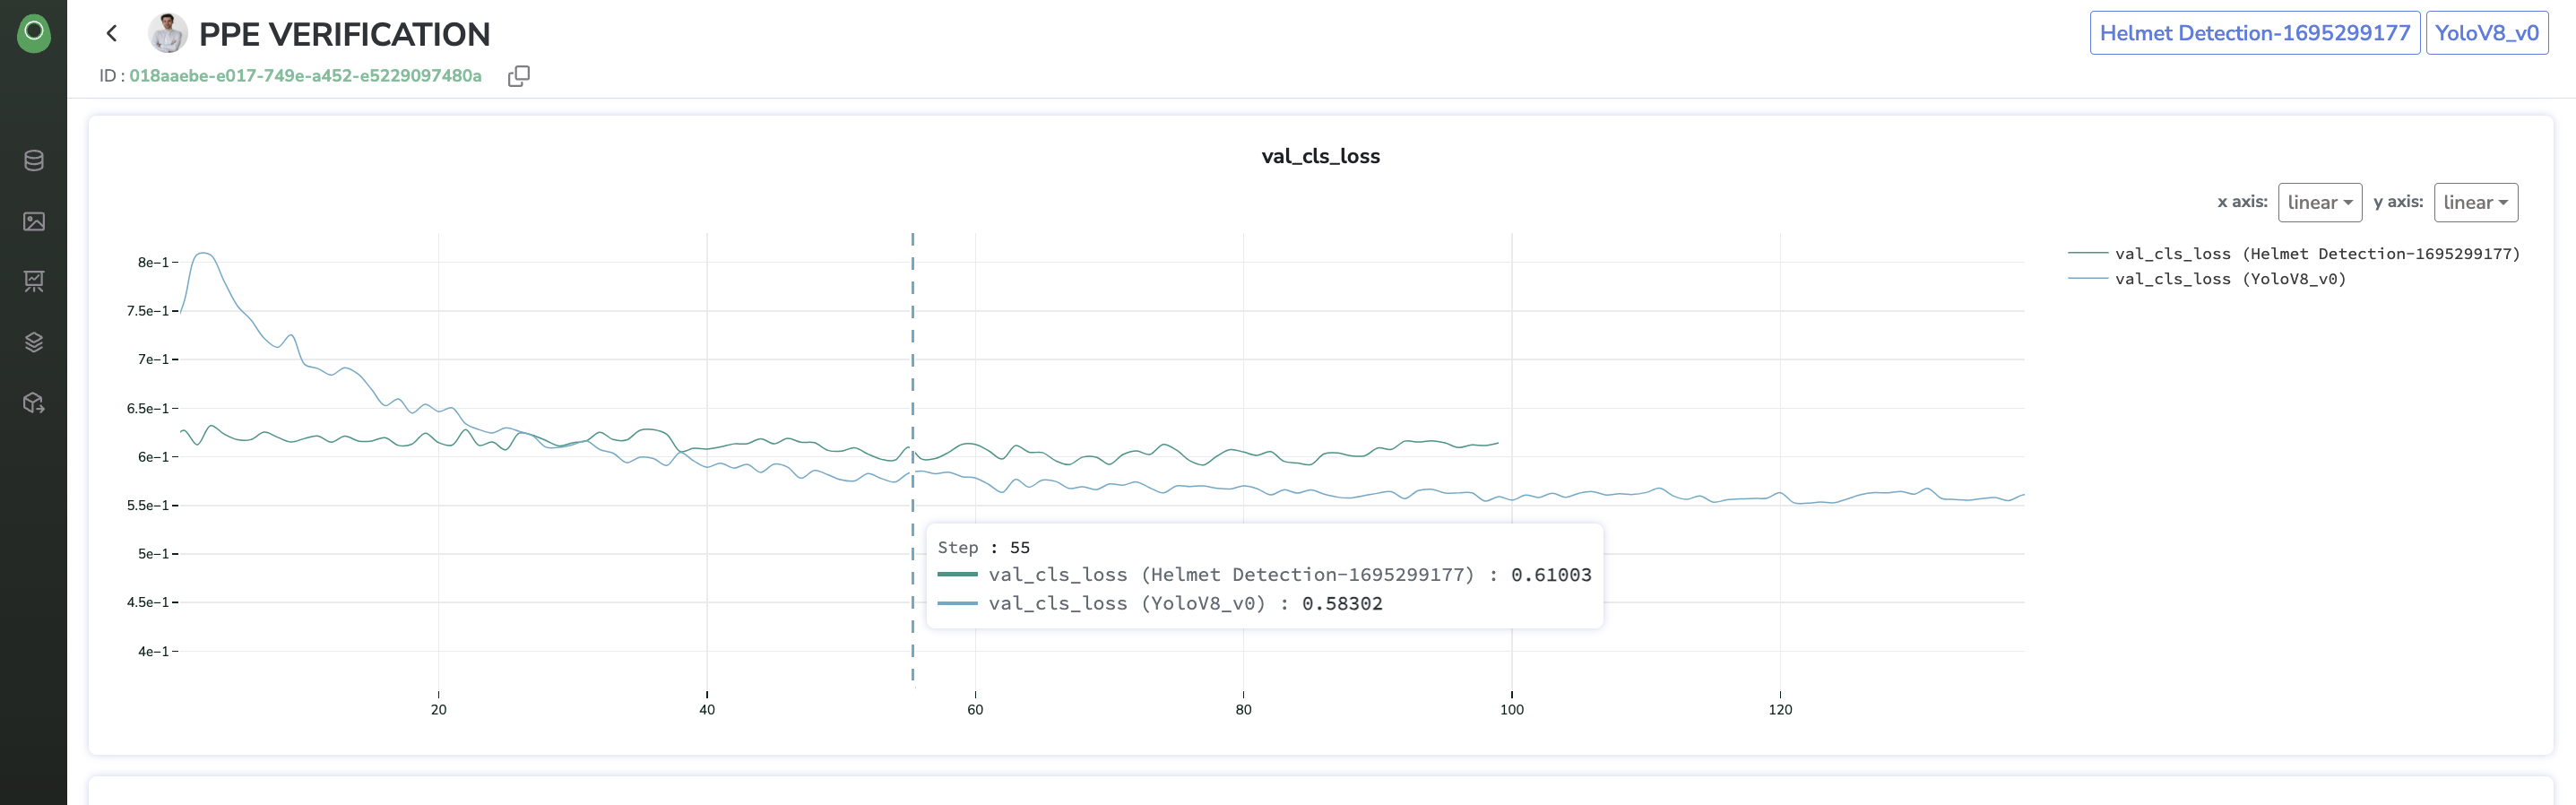
Line Metric comparison
The Comparison view displays all the Metrics for both Experiment that share the same Metric type and Metric name.
Depending on the Metric type, the visualization can differ: for Line, Multi-line, Table, and Bar, the values of the compared Experiment are combined under a single item, whereas for Single Value, Image, and Heatmap, the Metric values are displayed side-by-side.
As you might expect, comparing Experiment is most valuable when the compared Experiment use the same training script, or at least training scripts that log the same kind of Metrics to the Experiment Tracking dashboard.
You can compare as many Experiment as you want, but above a certain number, the visualization in the Comparison view might be impacted. If you want to remove an Experiment from the Comparison view, click on its name in the top right corner.
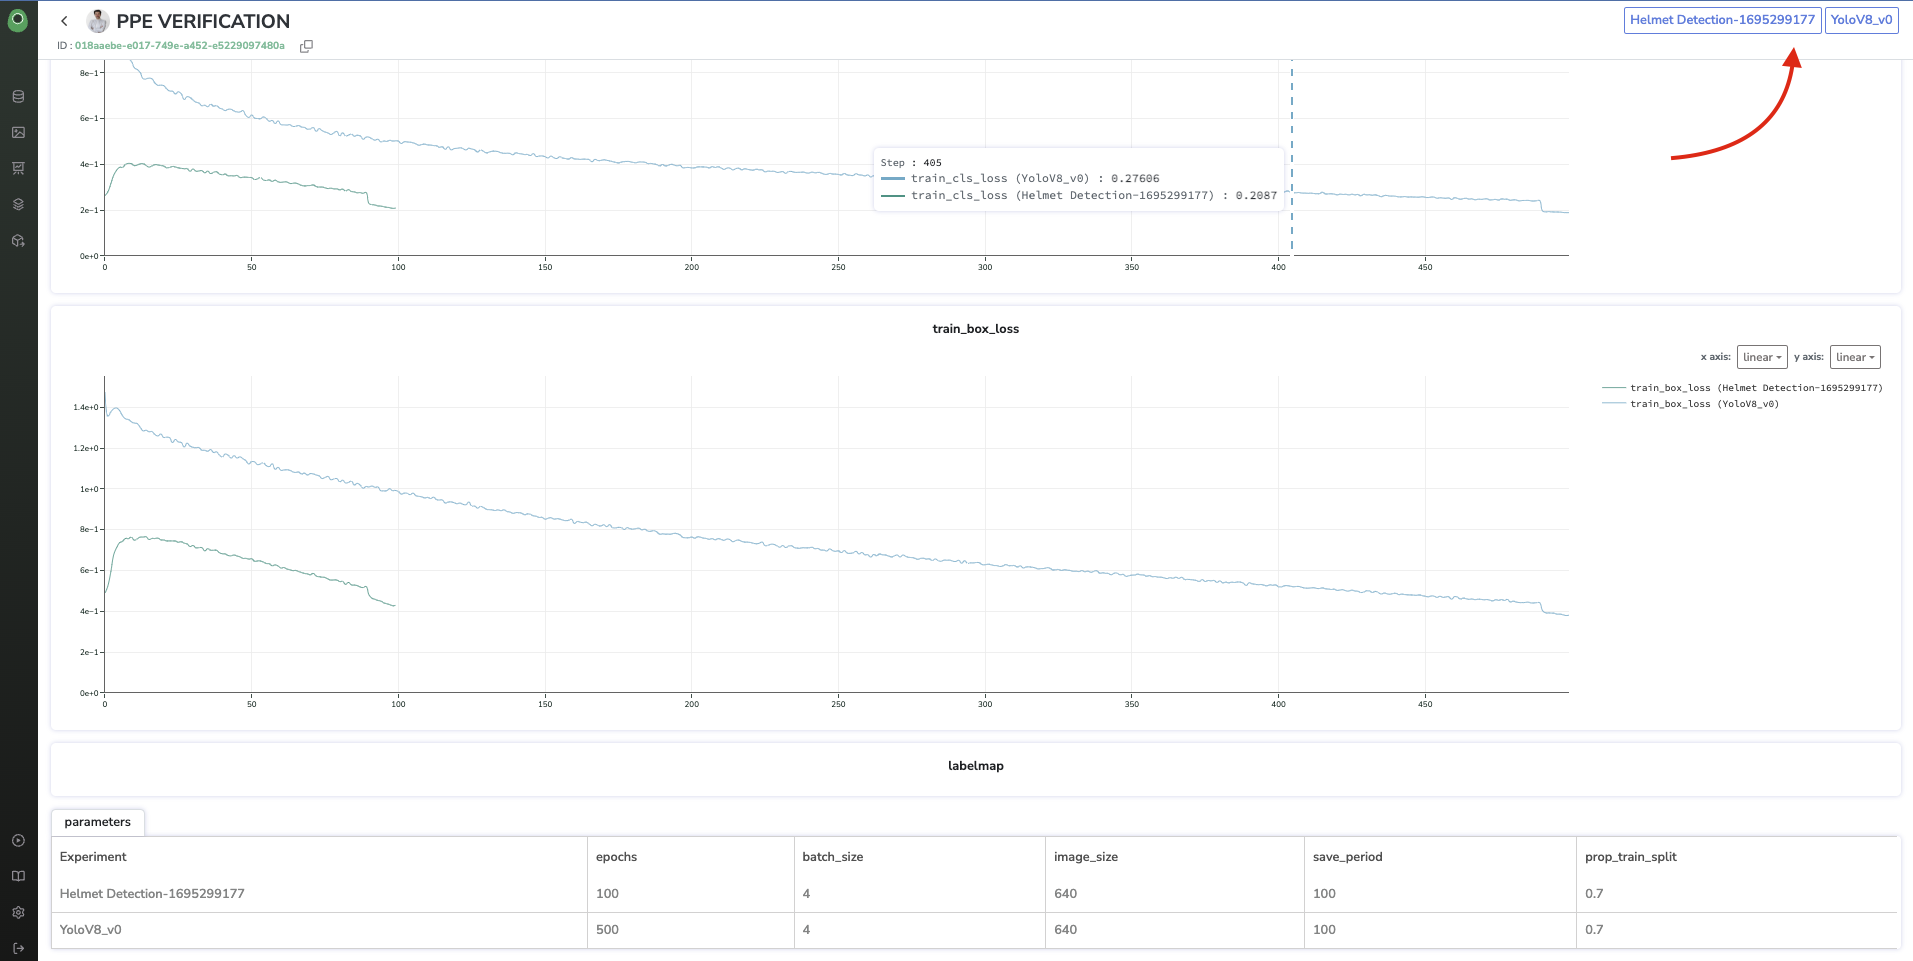
Remove an Experiment from the Comparison view
You now have all the insights you need to properly compare two Experiment and assess which one suits your needs.
2. Compare Evaluations
Comparing Logs tells you which Experiment trained better on aggregate; comparing Evaluation lets you see, Asset by Asset, how two or more ModelVersion actually disagree on the same data — the ground truth/prediction visualization detailed in Evaluation, but with every compared Experiment's prediction overlaid on the same image at once. This is where two Experiment with nearly identical Metrics can turn out to behave very differently in practice — one missing Shape in low-light conditions, the other over-detecting on cluttered backgrounds — the kind of pattern that stays invisible in an aggregate score but jumps out as soon as you look at the same Asset side by side.
This comparison is only available between Experiment that share a common evaluated DatasetVersion. From the Experiments tab of a Project, select two or more such Experiment; a Compare evaluations on button then appears next to Compare logs, naming the shared DatasetVersion and how many of the selected Experiment were evaluated on it. If your selection shares more than one DatasetVersion, a dropdown lets you pick which one to compare Evaluation on.

Select Experiment to compare on Evaluation
Clicking it opens the Compare evaluations view: the same Grid, Table, and Details views, ordering, filtering, and Query Language search bar as the regular Evaluations interface, but for every Asset of the shared DatasetVersion, the ground truth and the prediction of each compared Experiment are overlaid together, each labeled with its own confidence score.
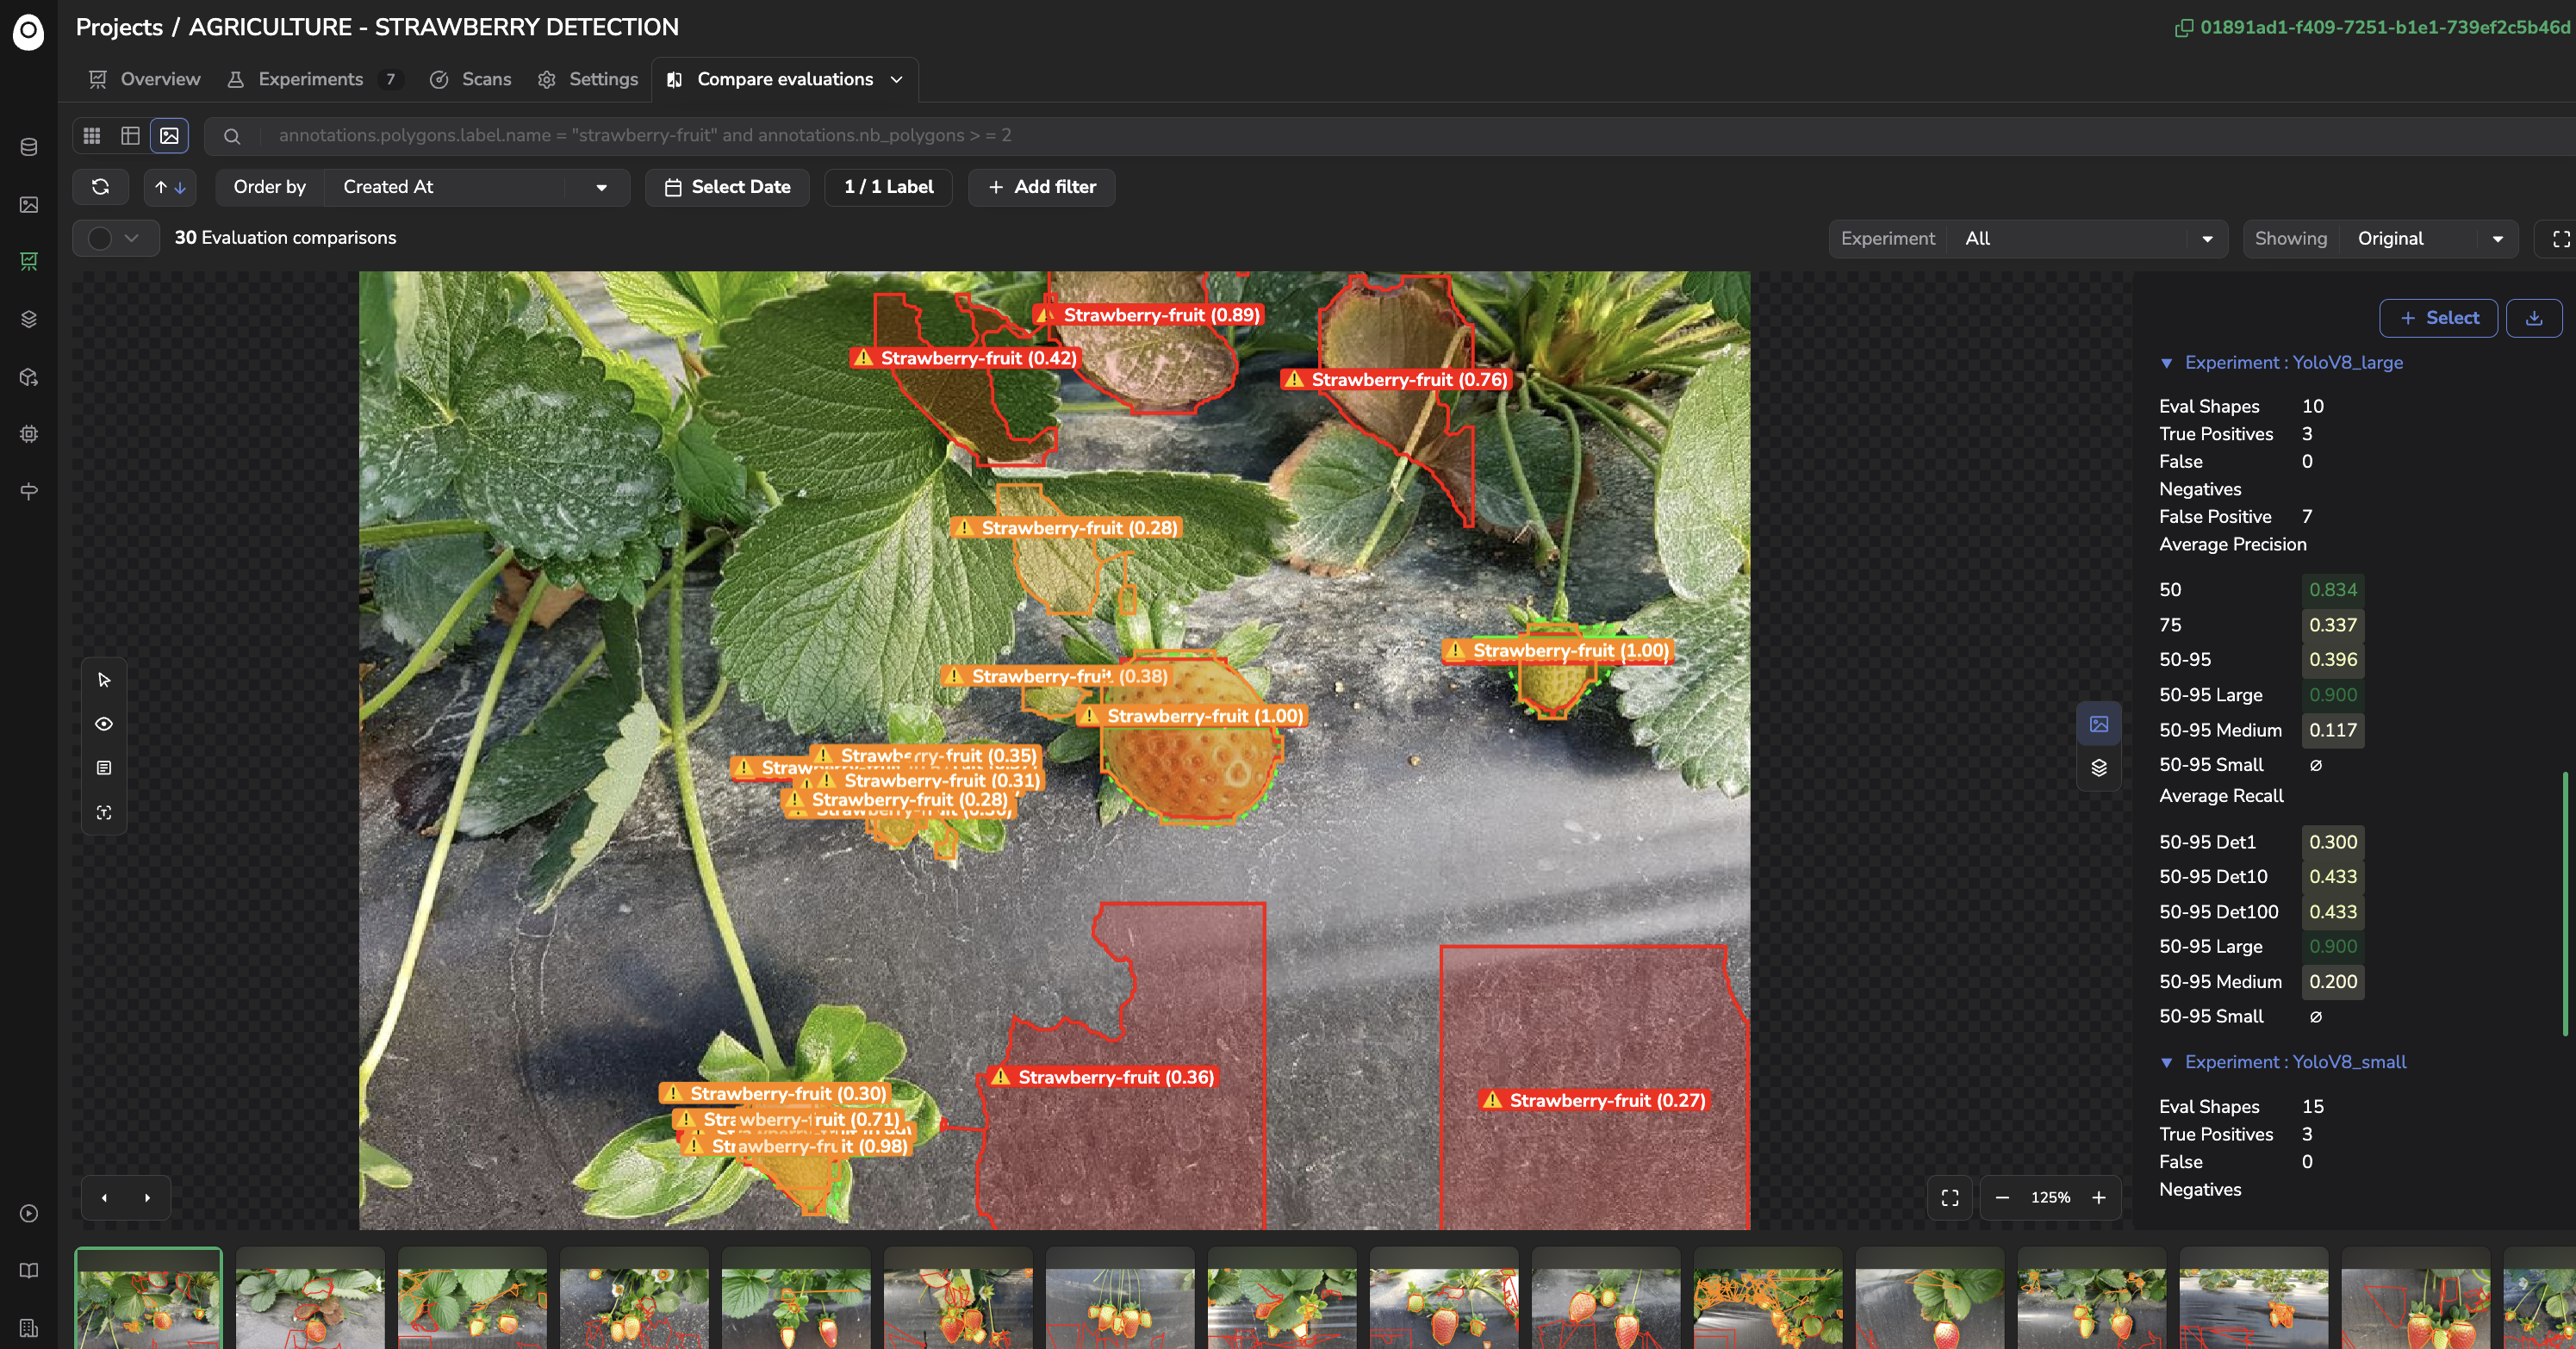
Evaluation Comparison on Details view
Next to the usual filters, an Experiment dropdown lets you isolate what is overlaid on the image: all compared Experiment plus the ground truth at once (the default), one compared Experiment's predictions alone, or the ground truth alone. Each source is color-coded consistently across the view, so a Shape's color tells you at a glance which Experiment — or the ground truth — it came from.
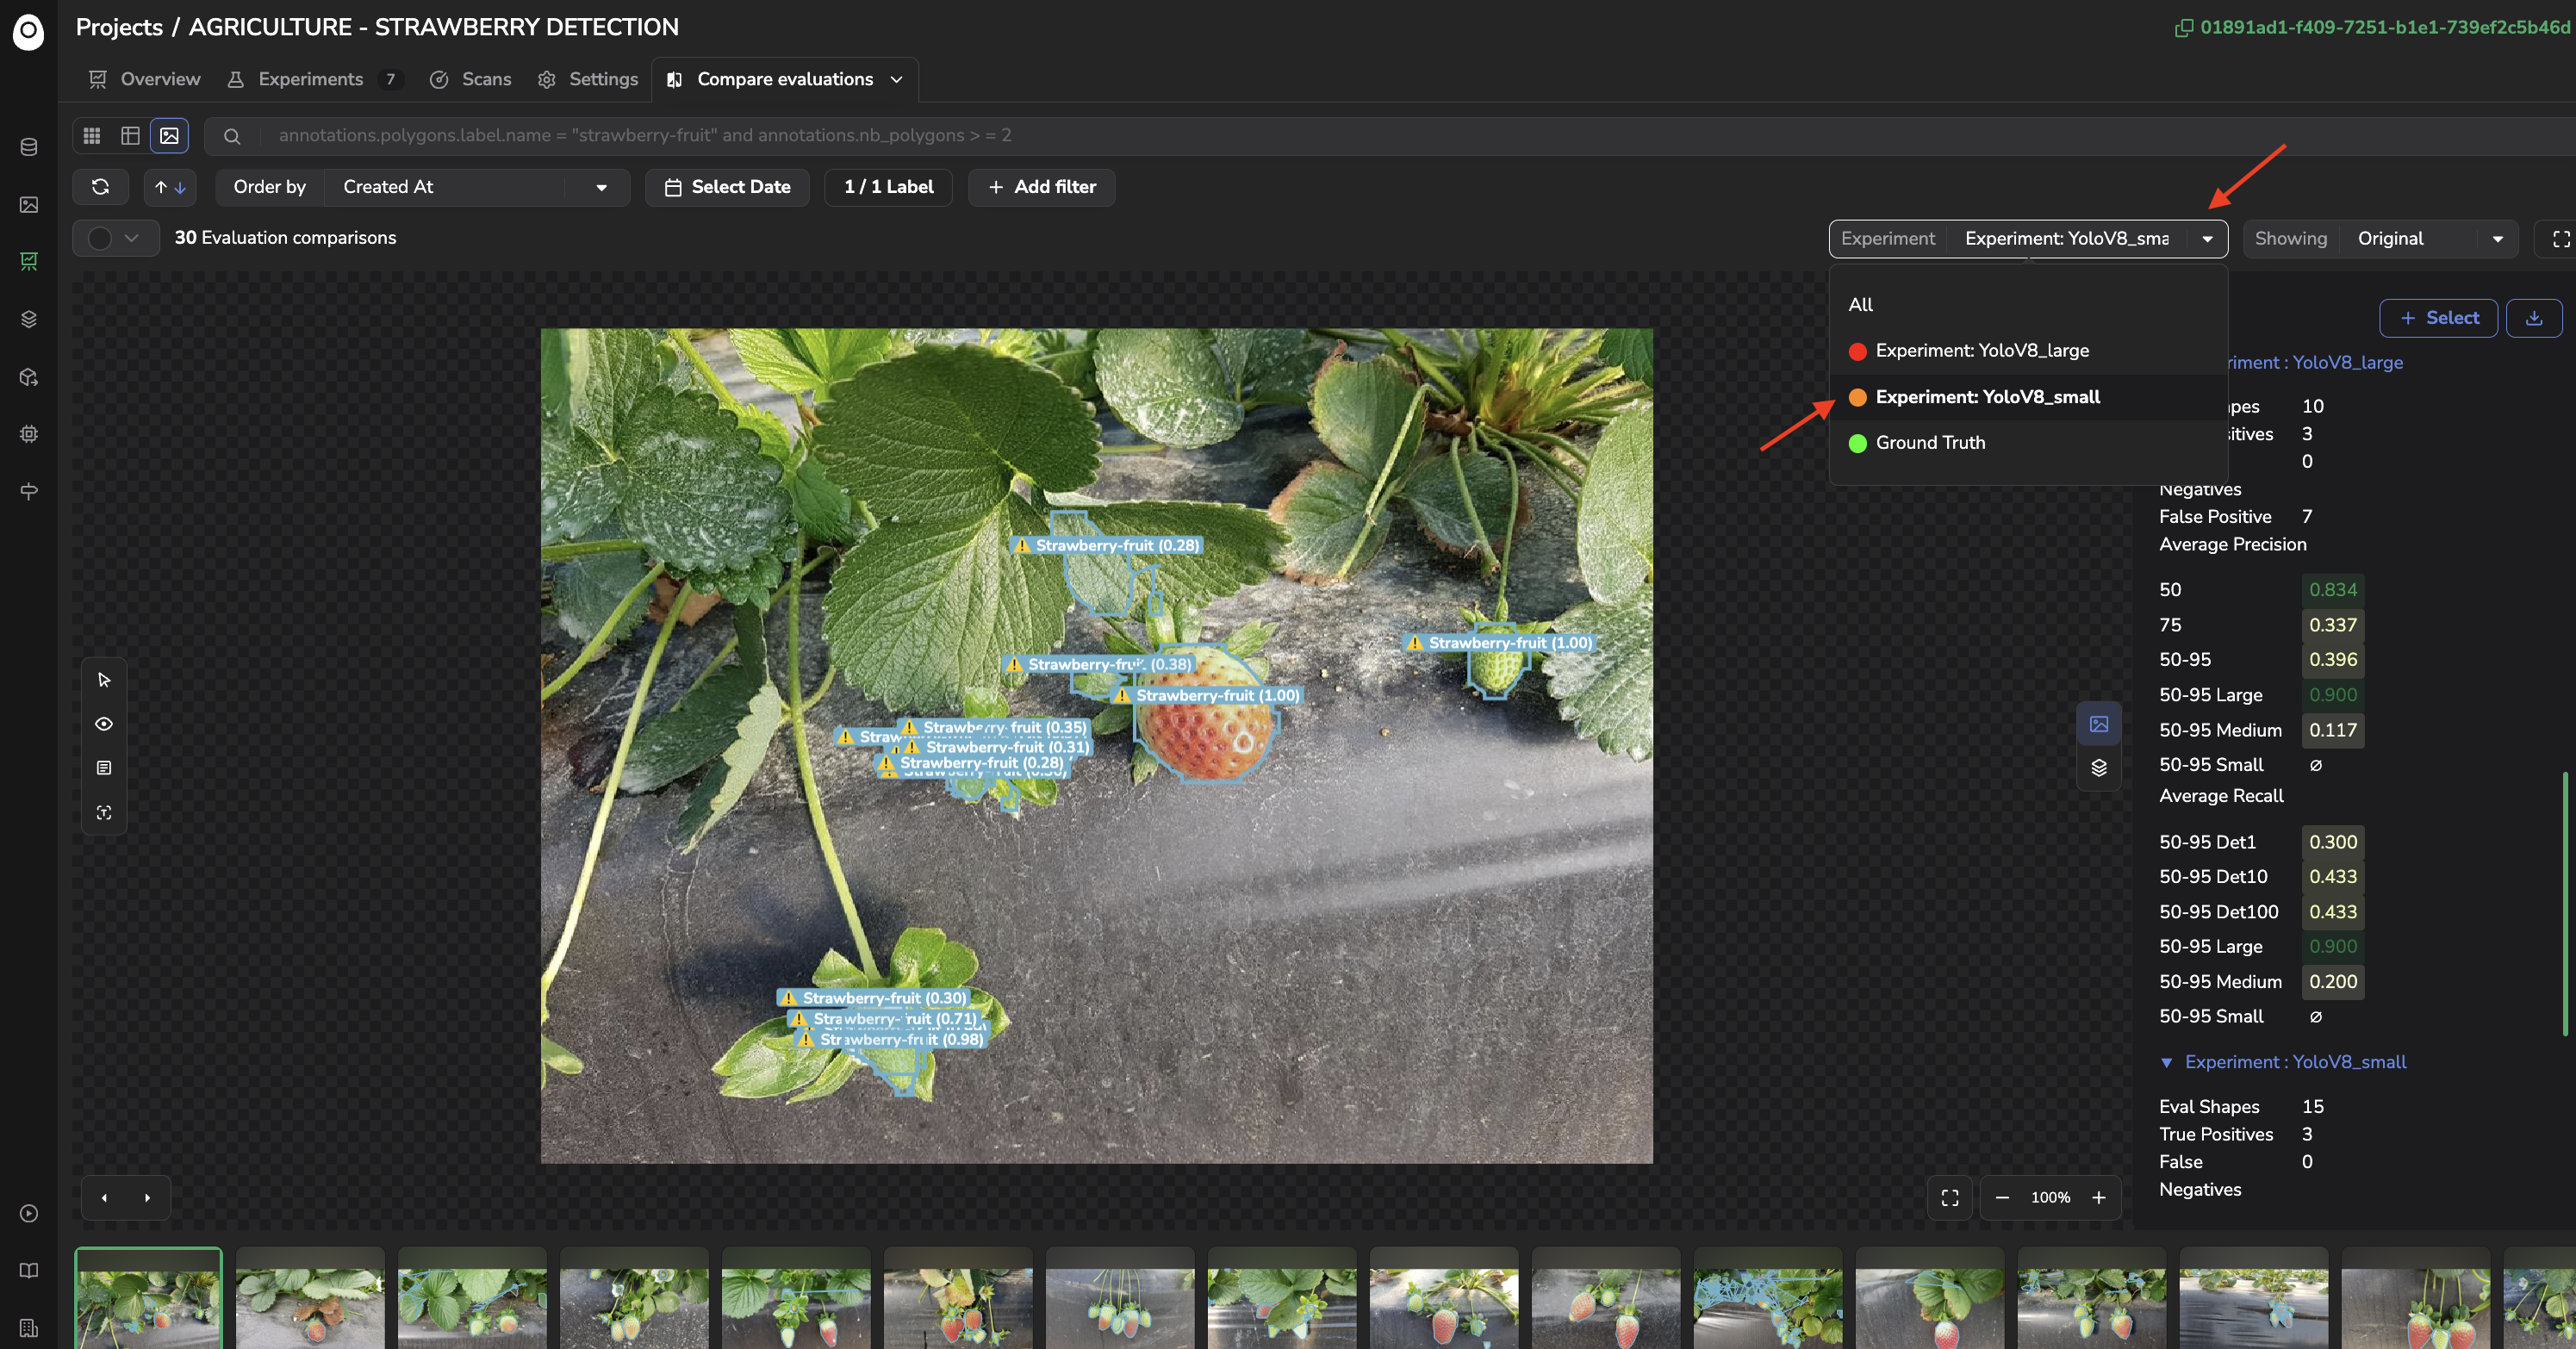
Isolation of one Annotation (Ground Truth or one Experiment among selected ones)
Updated 13 days ago