Deployments - Overview
From the Deployments list, by clicking on the Name of a Deployment, you will land on the Deployment overview.
This overview is composed of three tabs:
- Dashboard, where you can access the metrics related to performances of the
ModelVersionin the frame of the currentDeployment - Predictions, which allows you to visualize the predicted images and associated Predictions
- Settings
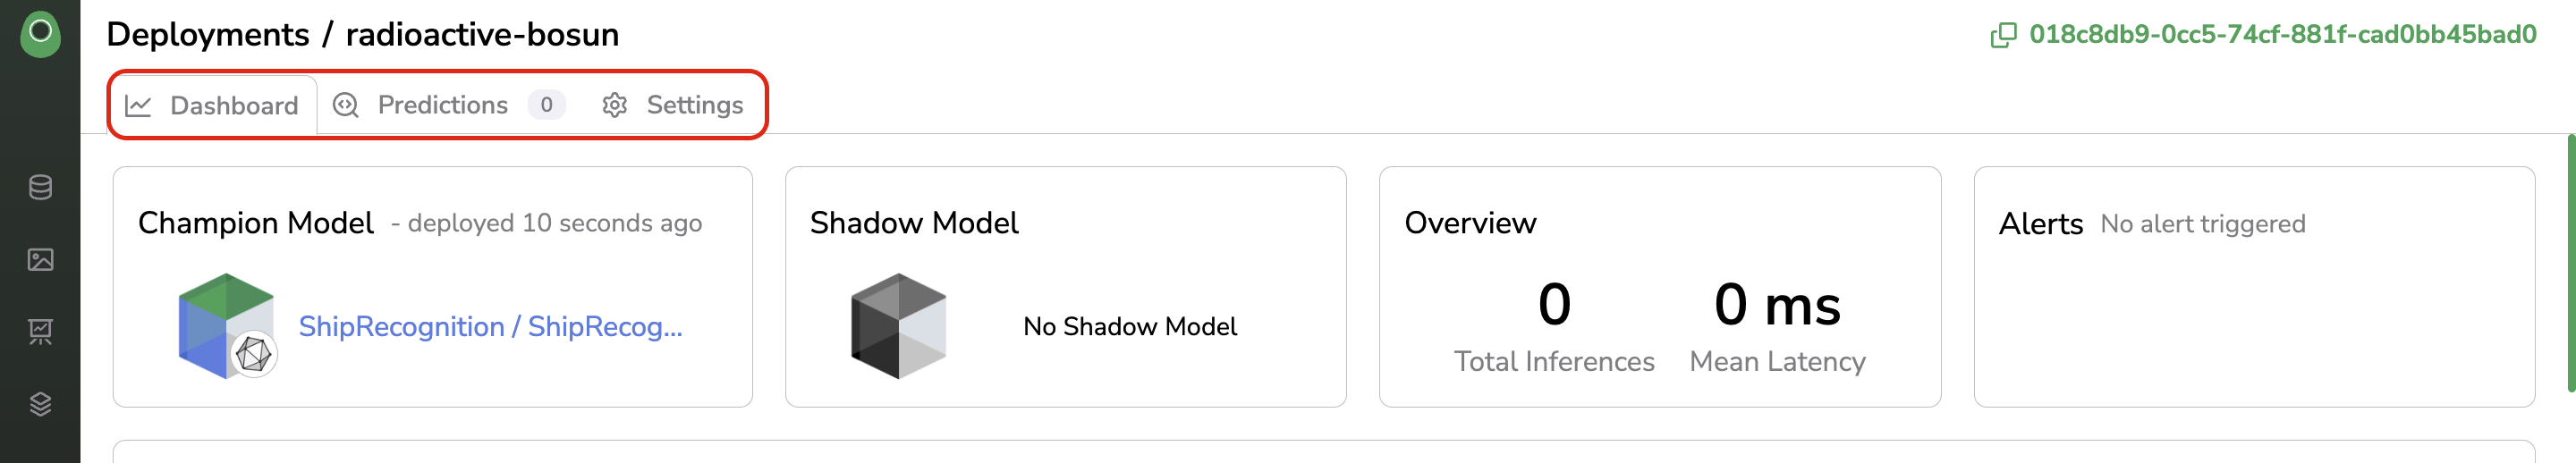
Deployment overview
DeploymentNameIn the header of the Deployment overview, you can see the
DeploymentName. This name is randomly generated by Picsellia when instantiating theDeployment, but for sure it can be renamed in the Settings tab.
1. Dashboard
The Dashboard tab aims to give you a clear and comprehensive idea of the health status of your Deployment.
It is composed of several contextual information and metrics.
The contextual information are displayed on top of the Dashboard. You'll retrieve:
- Champion Model: The
ModelandModelVersiondeployed in the currentDeploymentas a clickable link. - Shadow Model: The
ModelandModelVersionpotentially deployed as a Shadow Model in the currentDeploymentas a clickable link. - The number of inferences performed already in this
Deploymentand the associated mean latency - The list of Alerts triggered in the frame of this
Deployment
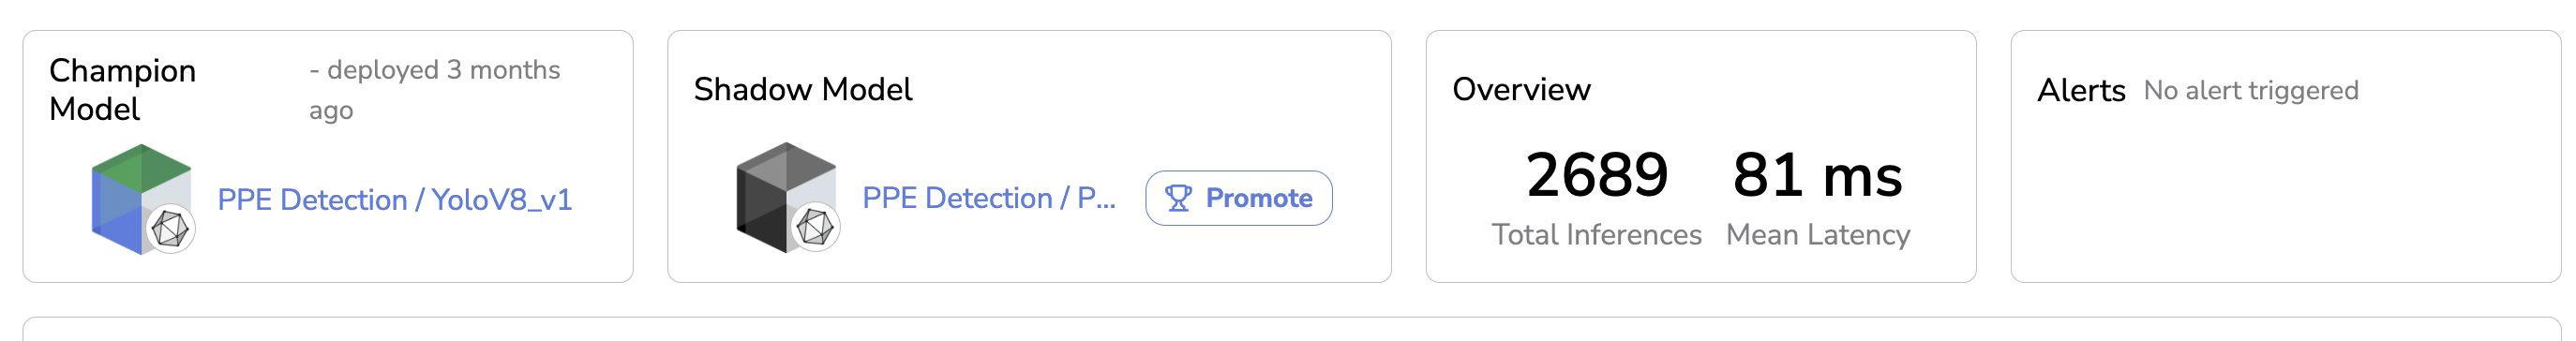
Contextual information of a Deployment
Below, the Dashboard displays many types of metrics that any user can use to assess the quality of the ModelVersion behavior.
Those metrics are divided into two categories:
- Supervised metrics
- Unspuservised metrics
Details about each metric available are listed in the dedicated page here.
2. Predictions
The Predictions tab displays an overview of all the PredictedAsset andPrediction logged in the current Deployment.
The Predictions overview followed the same philosophy as other image overviews on Picsellia such as the Assets overview. This overview will allow you to visualize all the PredictedAssest, related Metadata and access the Prediction Review tool.
3. Settings
From the Settings tab, you can:
- Edit general information related to the current
Deployment - Setup and edit your Pipeline
- Create and edit Alerts
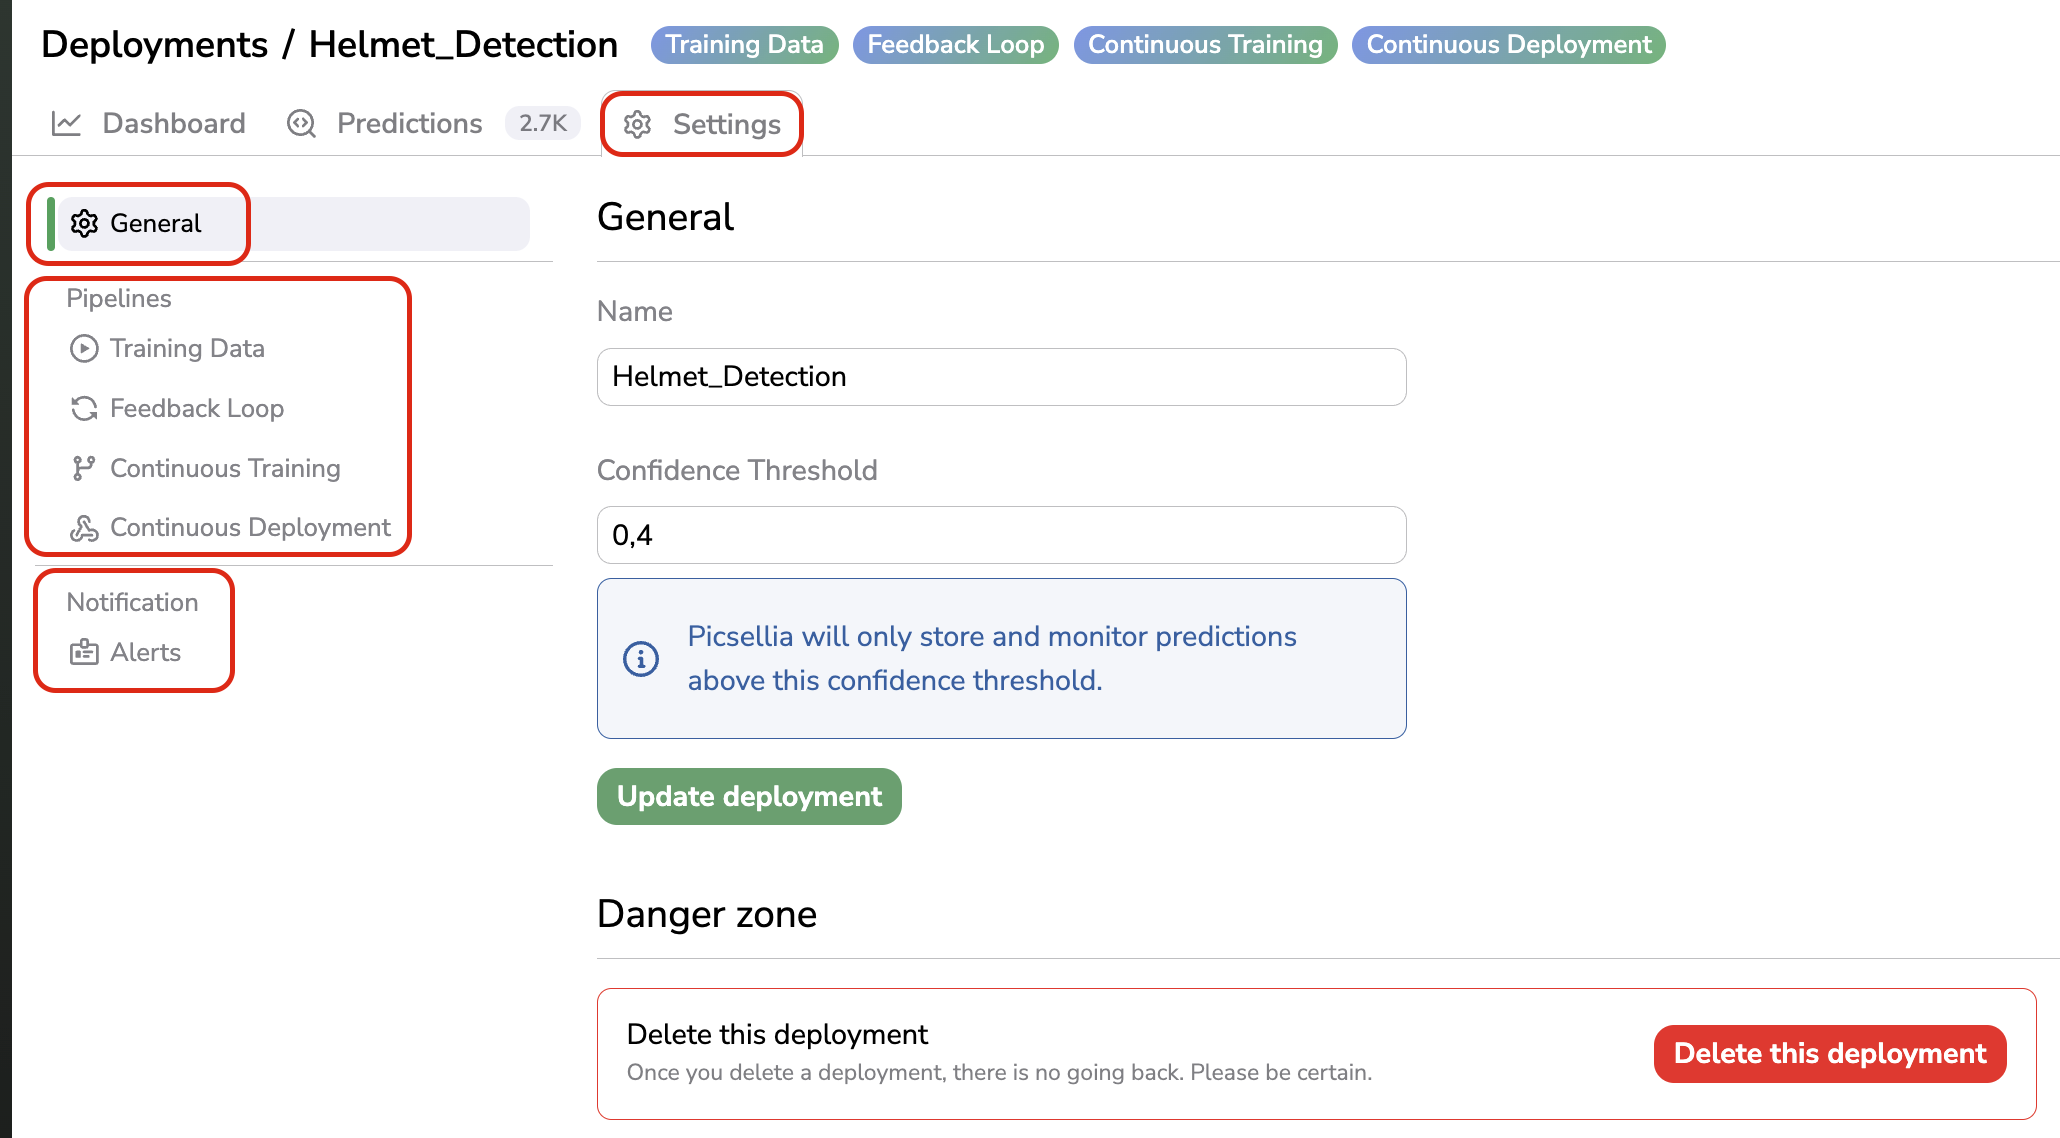
Settings tab
Please refer to the dedicated documentation pages for Pipeline and Alerts.
Let's have a look then in the General section of the Settings tab.
From here, you can rename your Deployment or modify its Confidence Threshold (meaning that any Shape with a confidence score below this threshold will be ignored), after any modification do not forget to save them by clicking on Update Deployment
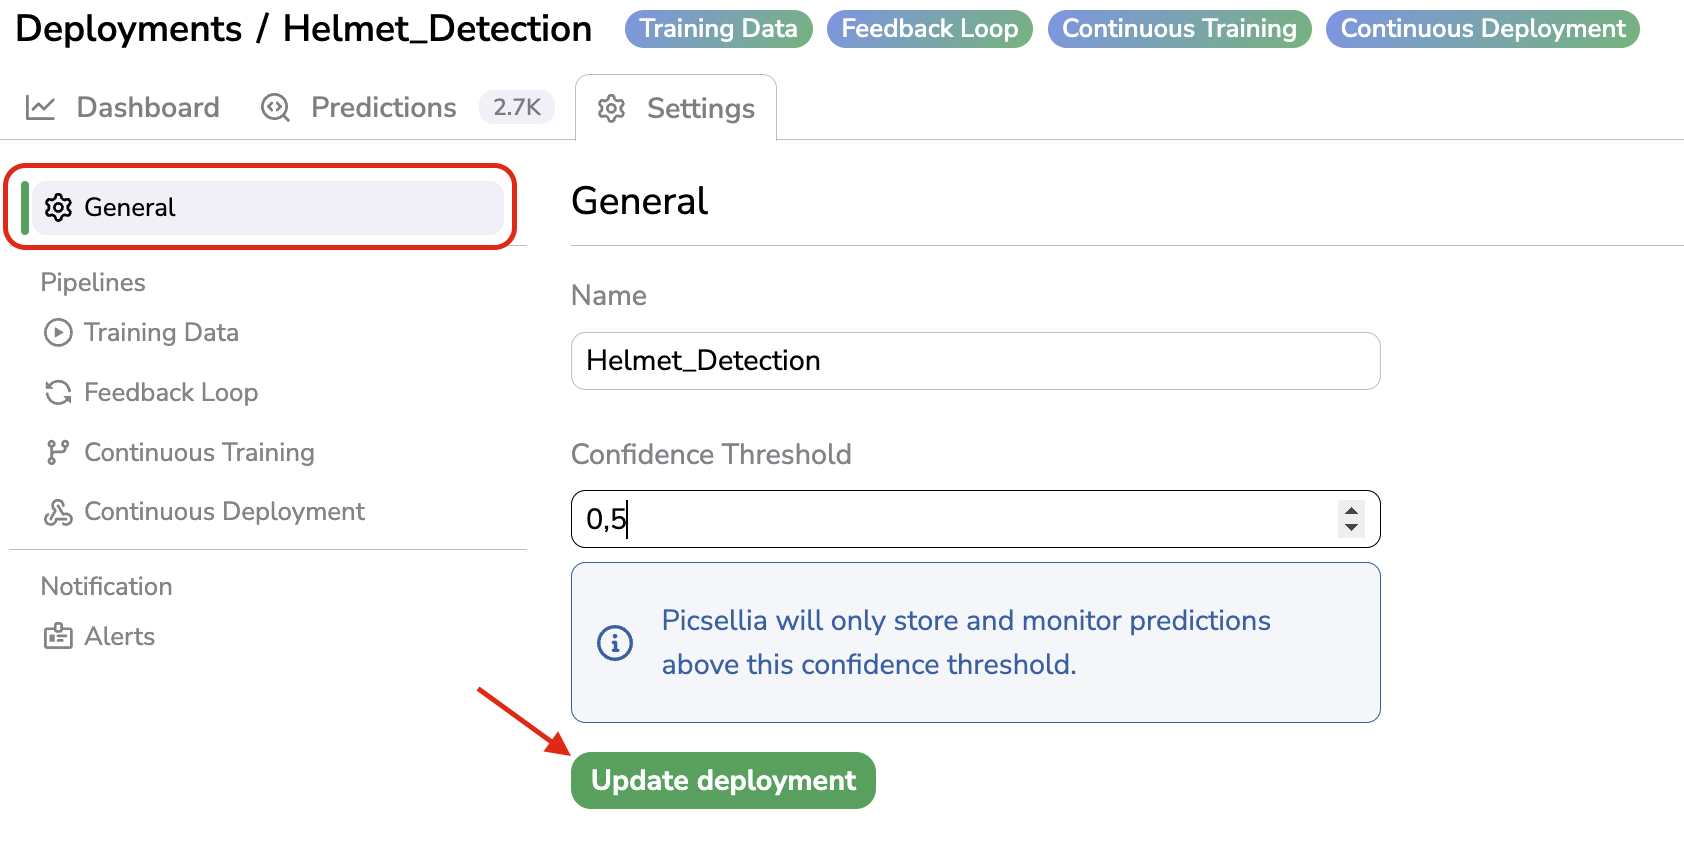
Update Deployment
From the General tab you can also delete the current Deployment by clicking on Delete this deployment, for security reasons, you will be asked to prompt the Deployment name.
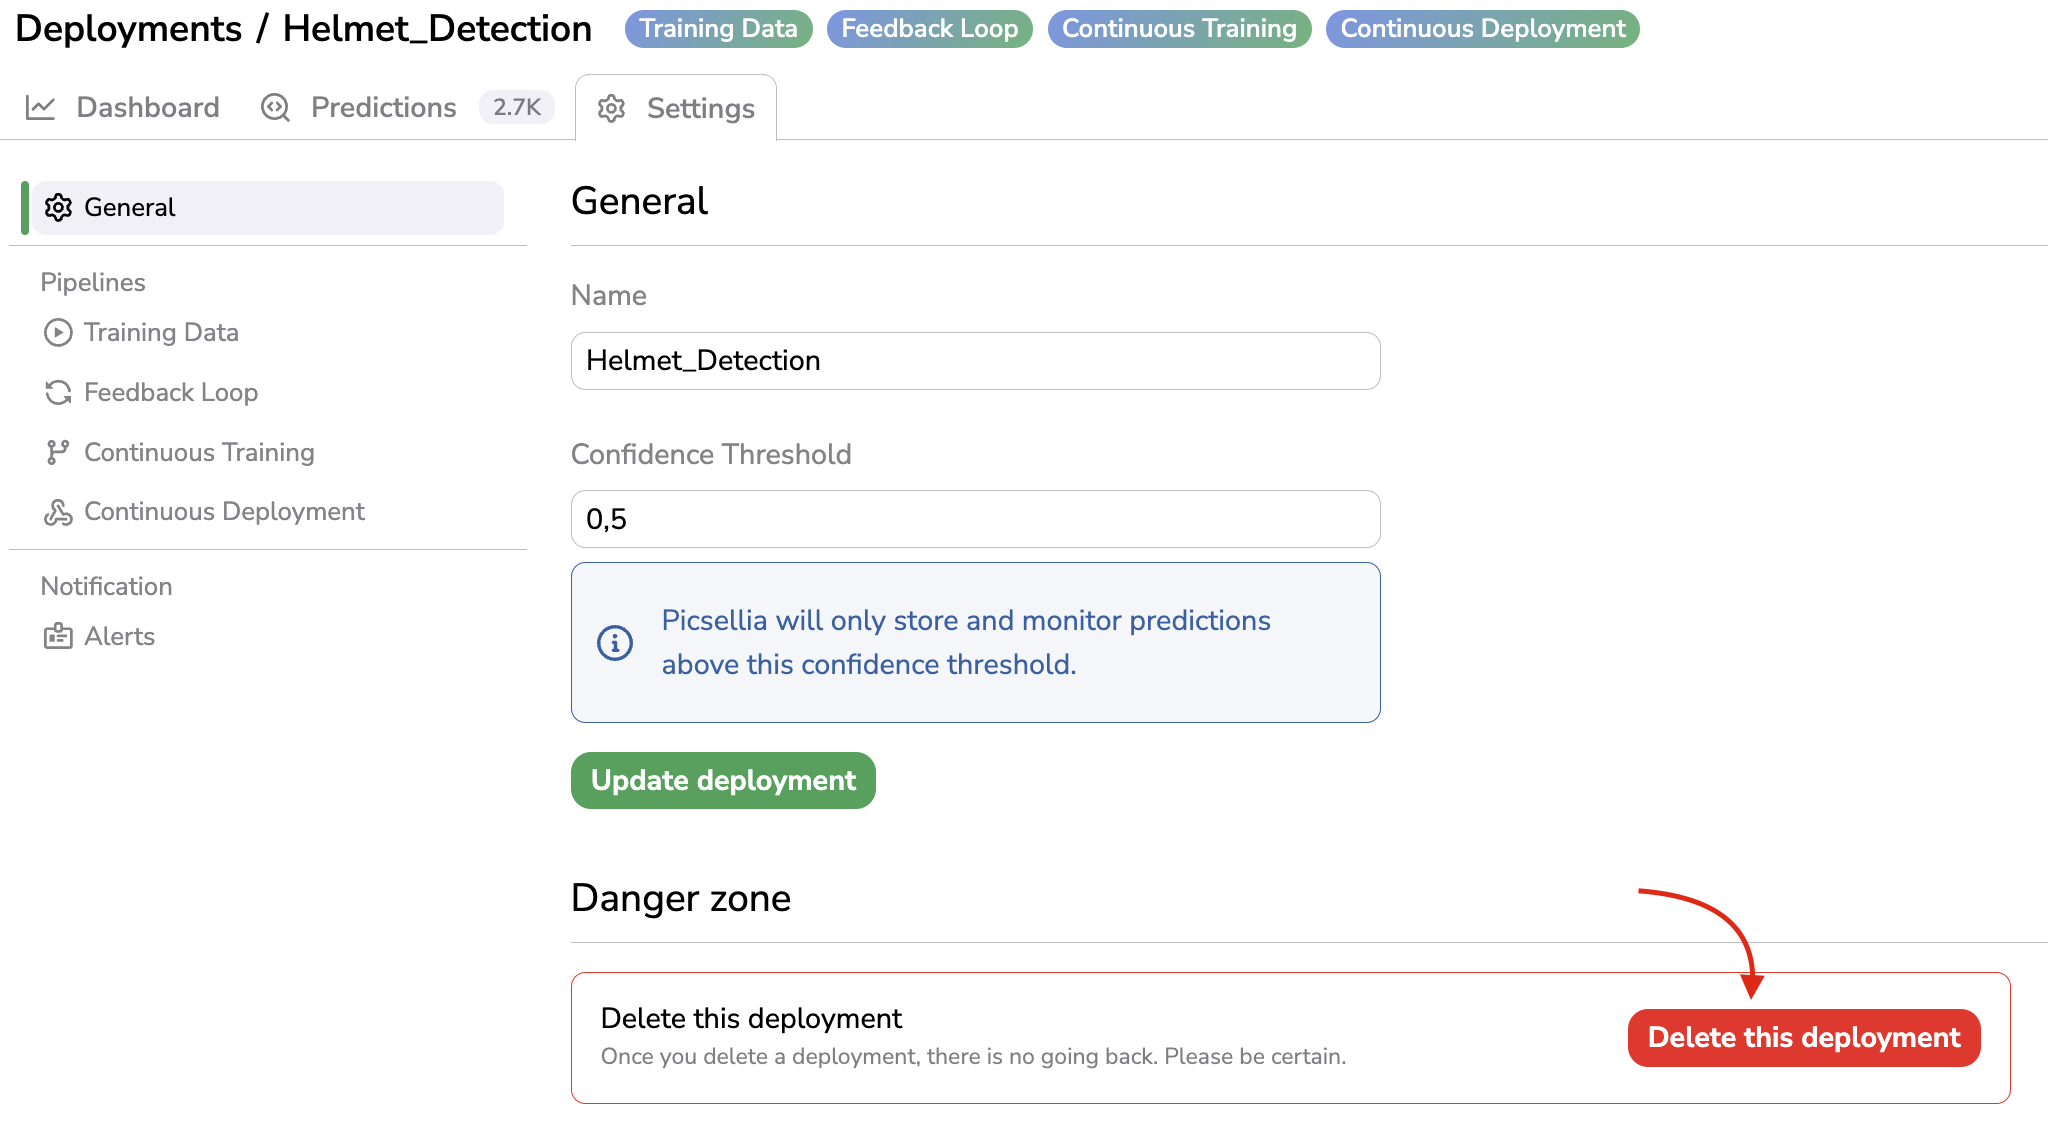
Deployment deletion
All the informations (Metrics,PredictedAsset,Prediction...) logged in the currentDeploymentwill be deleted.
However, as explained previously, each PredictedAsset logged in a Deployment is physically stored through the proper Storage Connector on the storage associated with the target Datalake selected while deploying the ModelVersion.
It means that each time a PredictedAsset is logged to a Deployment a new Data is created in the targetDatalake. As it is the case for Asset, PredictedAsset inherits from Data.
This means that when you delete a Data, any related PredictedAsset will be removed from their Deployment. But, when deleting a wholeDeployment, all the logged PredictedAsset will be deleted but their related Data will remain in the target Datalake.
Updated about 1 year ago