2. Dashboard overview
Now that you are all set, let's start by detailing all the features included in Picsellia Community.
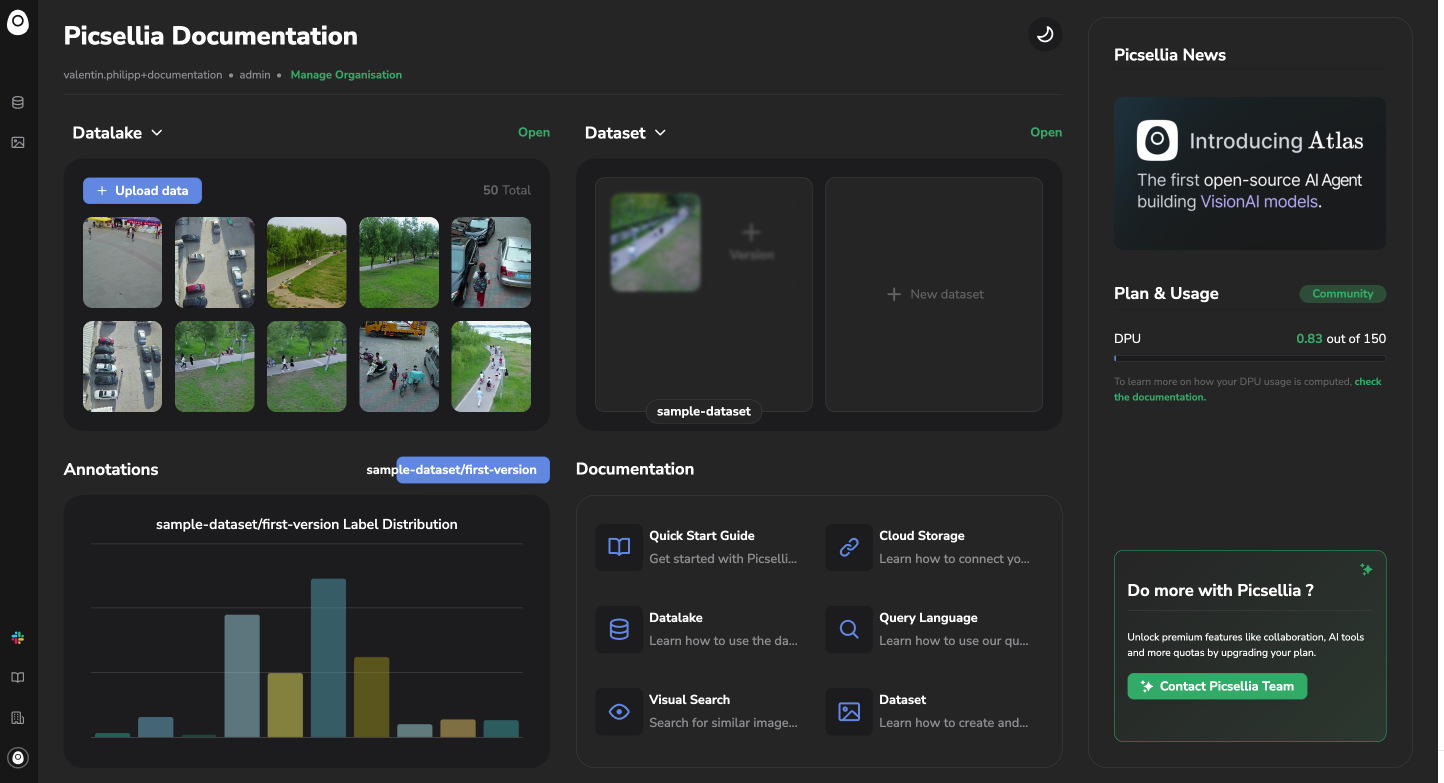
First of all, we'll focus a bit on the main Dashboard, in order to let you understand and use it properly!
From this Dashboard, you'll be able access the main documentation ressources, access the settings and track progress on your CV projects by having an overview on your Datalake, Datasets and the related existing Annotation.
1. Header
The Dashboard header, display the Organization name, the username of the connected user, its rights level and a link to the Organization settings as highlighted below. The Personal and Organization settings are documented in detail here.
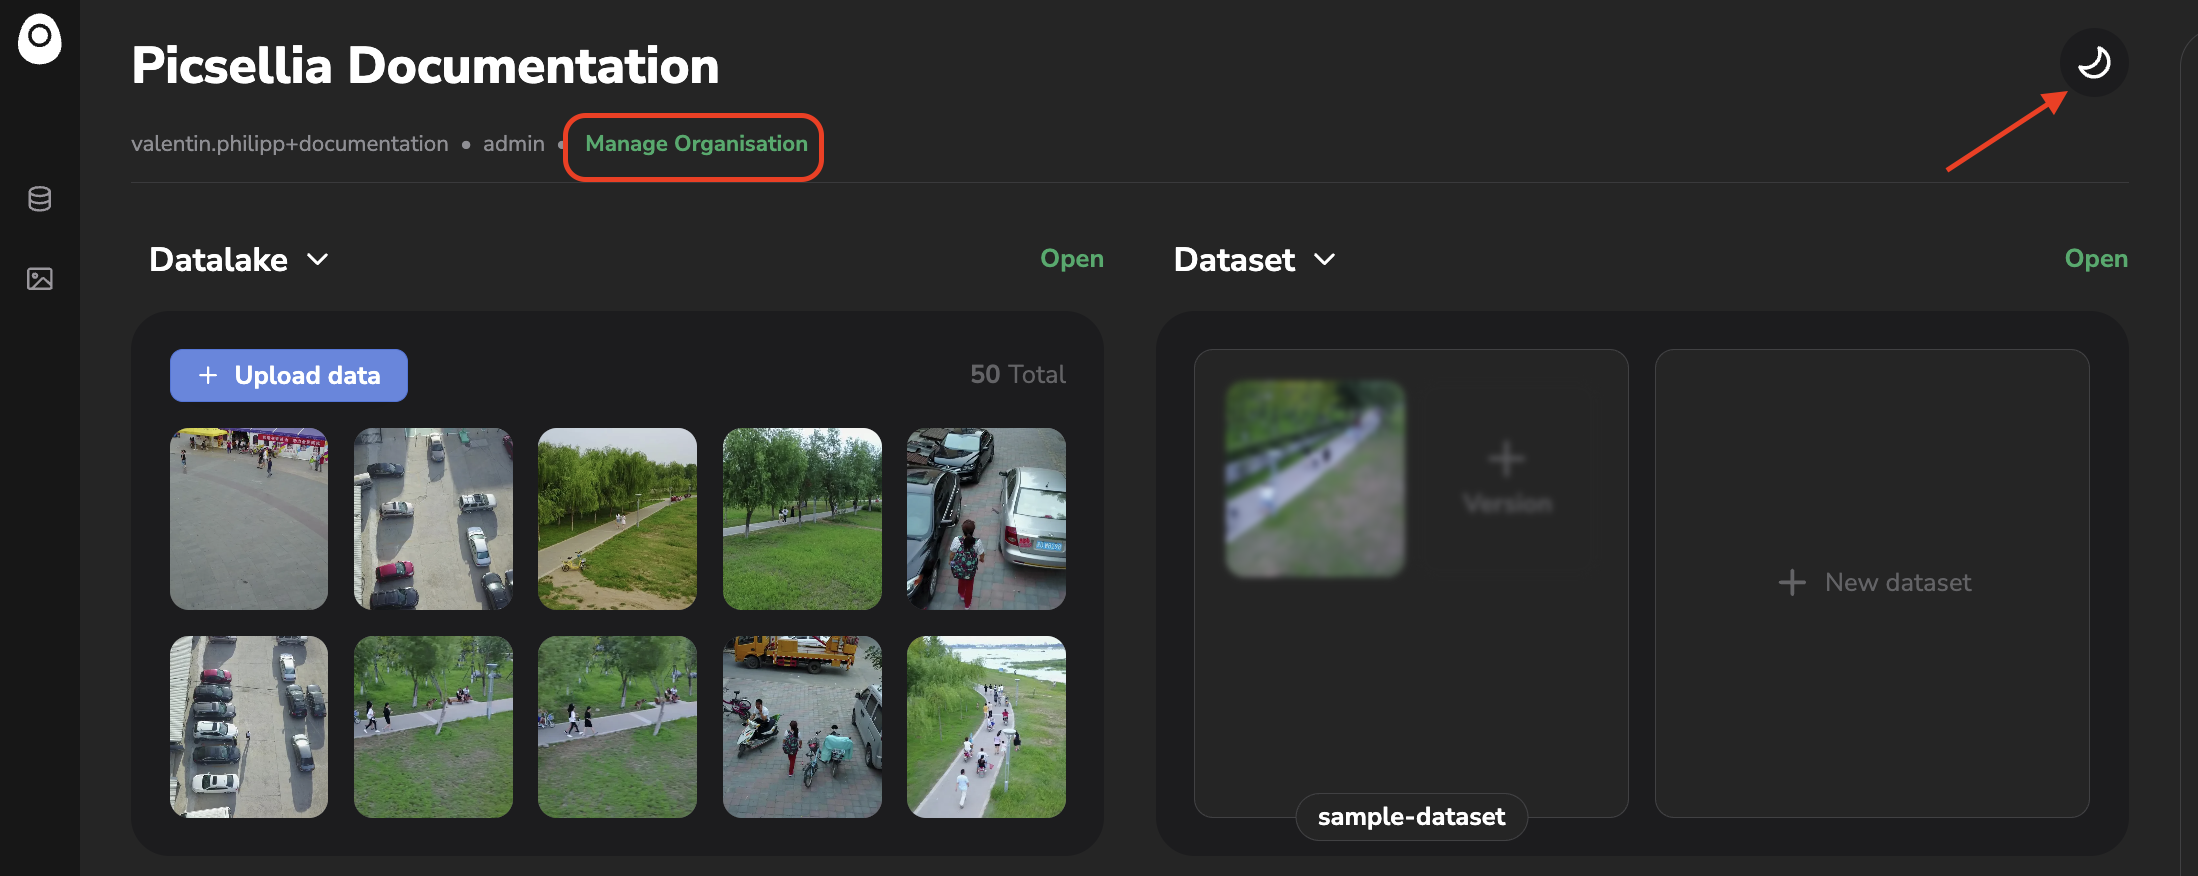
The moon icon in the top-right corner allow you to switch between Dark and Light mode ensuring the best experience.
2. Documentation
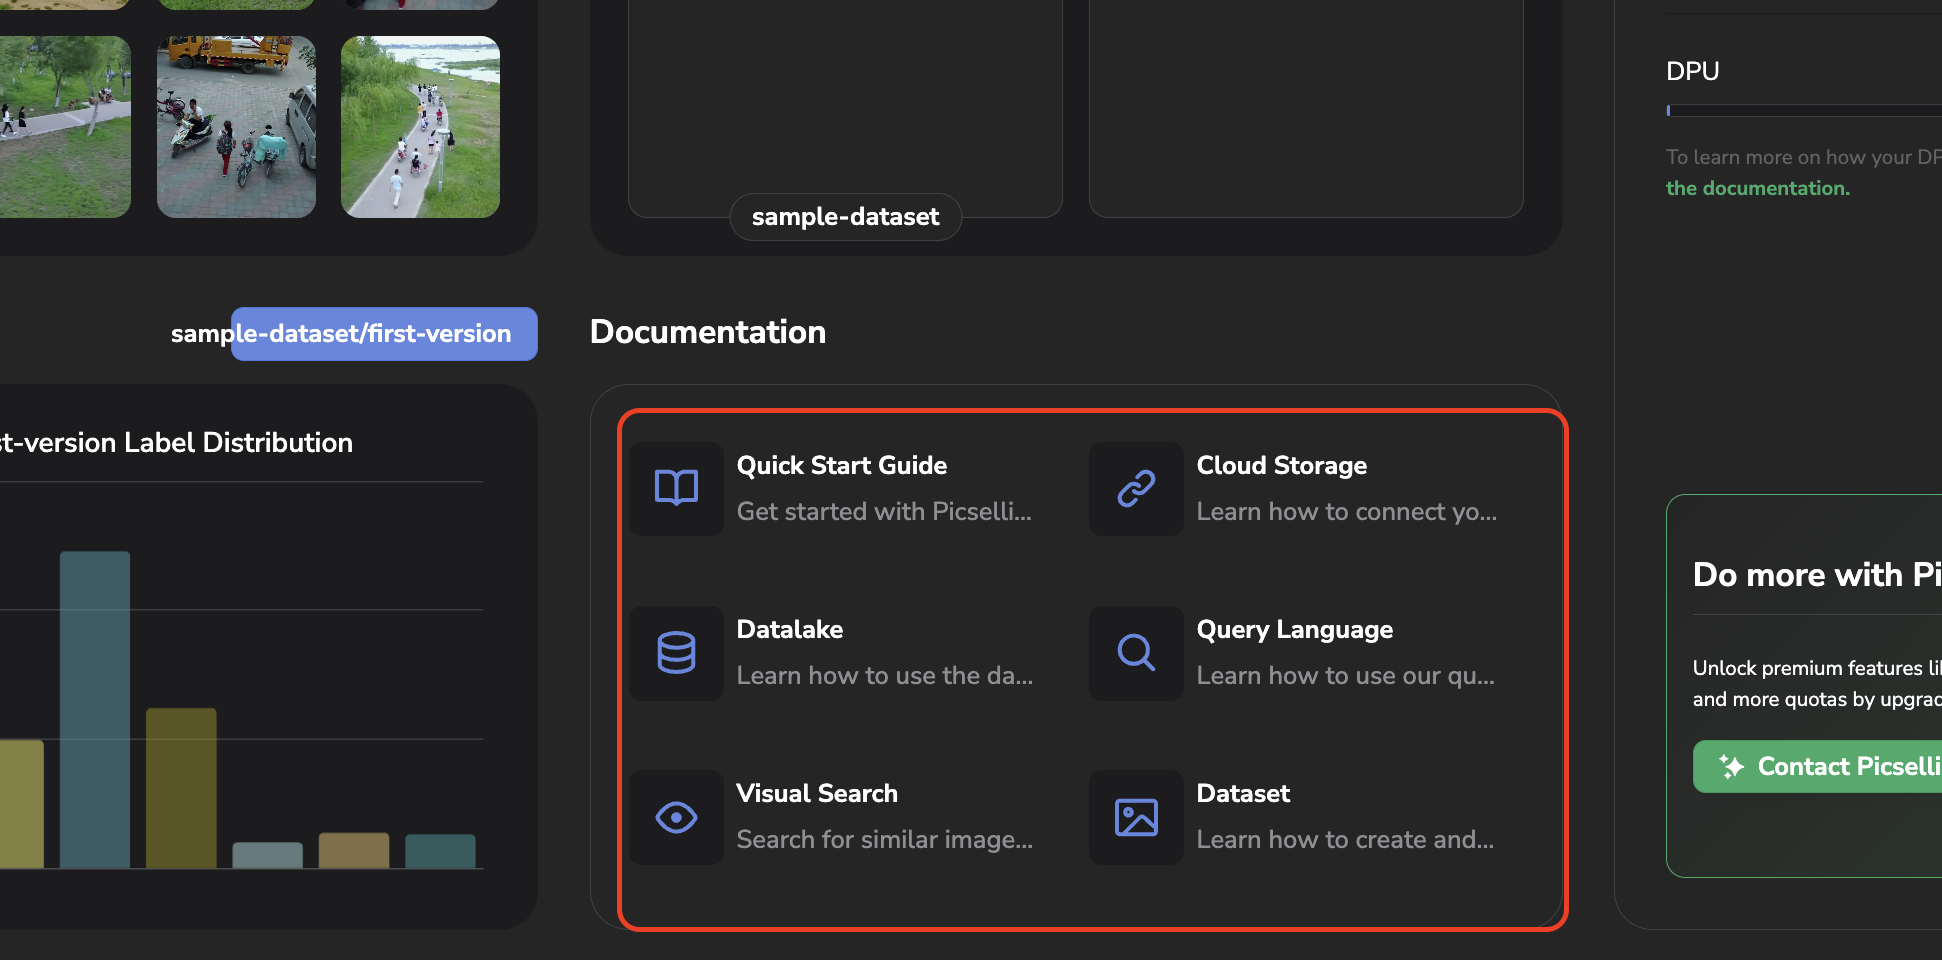
The Dashboard also embeds link to several useful documentation pieces. The listed documentation links are the main one you need to start using the main feature of Picsellia Community.
3. Picsellia news and consumption
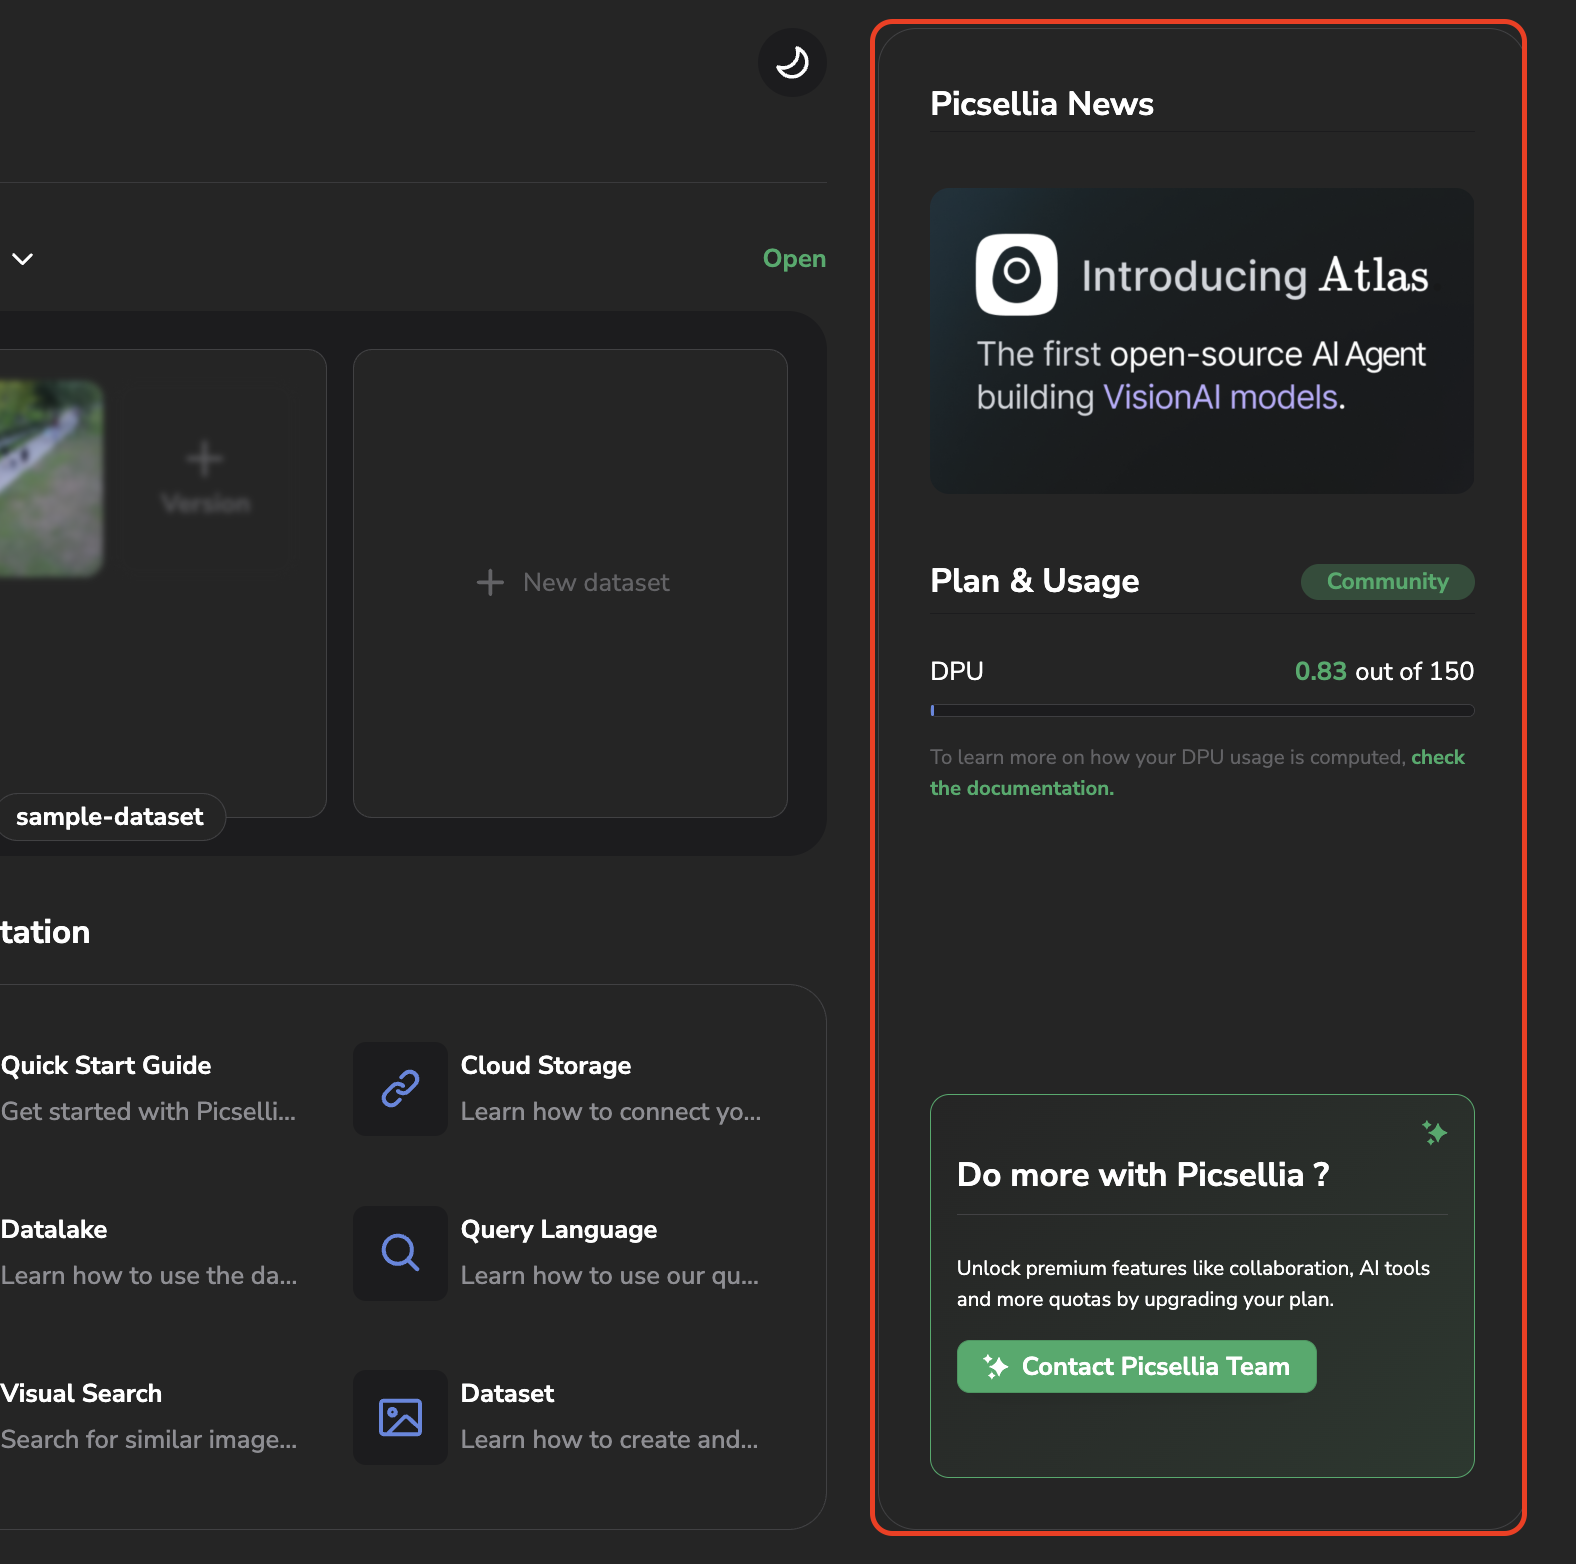
The right panel provides 3 main informations:
- The latest news about Picsellia
- The plan of the Organization (here it is a Community plan) and the current DPU consumption, which represents the number of images that can be updated in a Community Organization.
- A link to our contact form, allowing you to reach Picsellia team out in order to bring your Computer Vision projects to the next level
4. Datalake and Storage
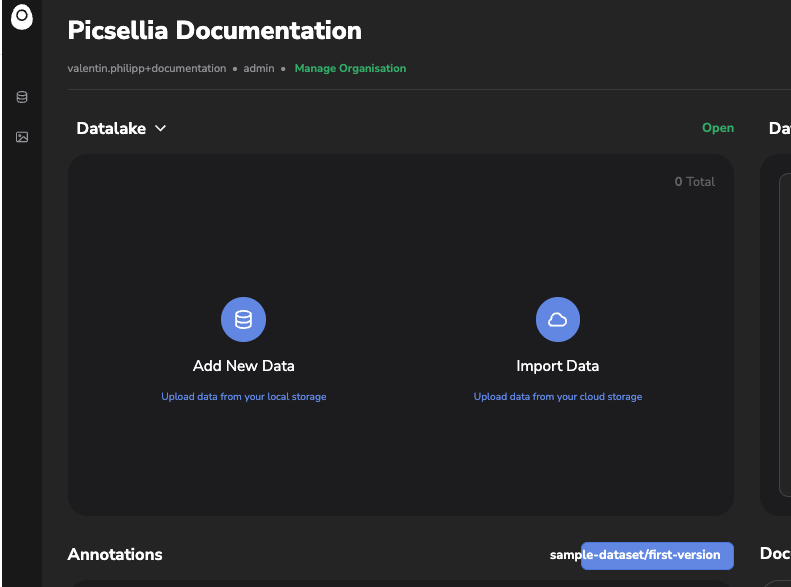
As documented in depth in this page, a Datalake always connected to an Object Storage (such as AWS S3_or_GCS) and allows you to visualize, explore and manipulate all the images stored on this one. Depending on the setup chosen during the Picsellia Community account creation, either you connected your own Object Storage to a Picsellia Datalake or an Object Storage has been automatically created for you and connected to your default Datalake. On the below exemple, the Datalake has been automatically connected to the Object Storage allocated by Picsellia for this account and filled with 50 sample Data.
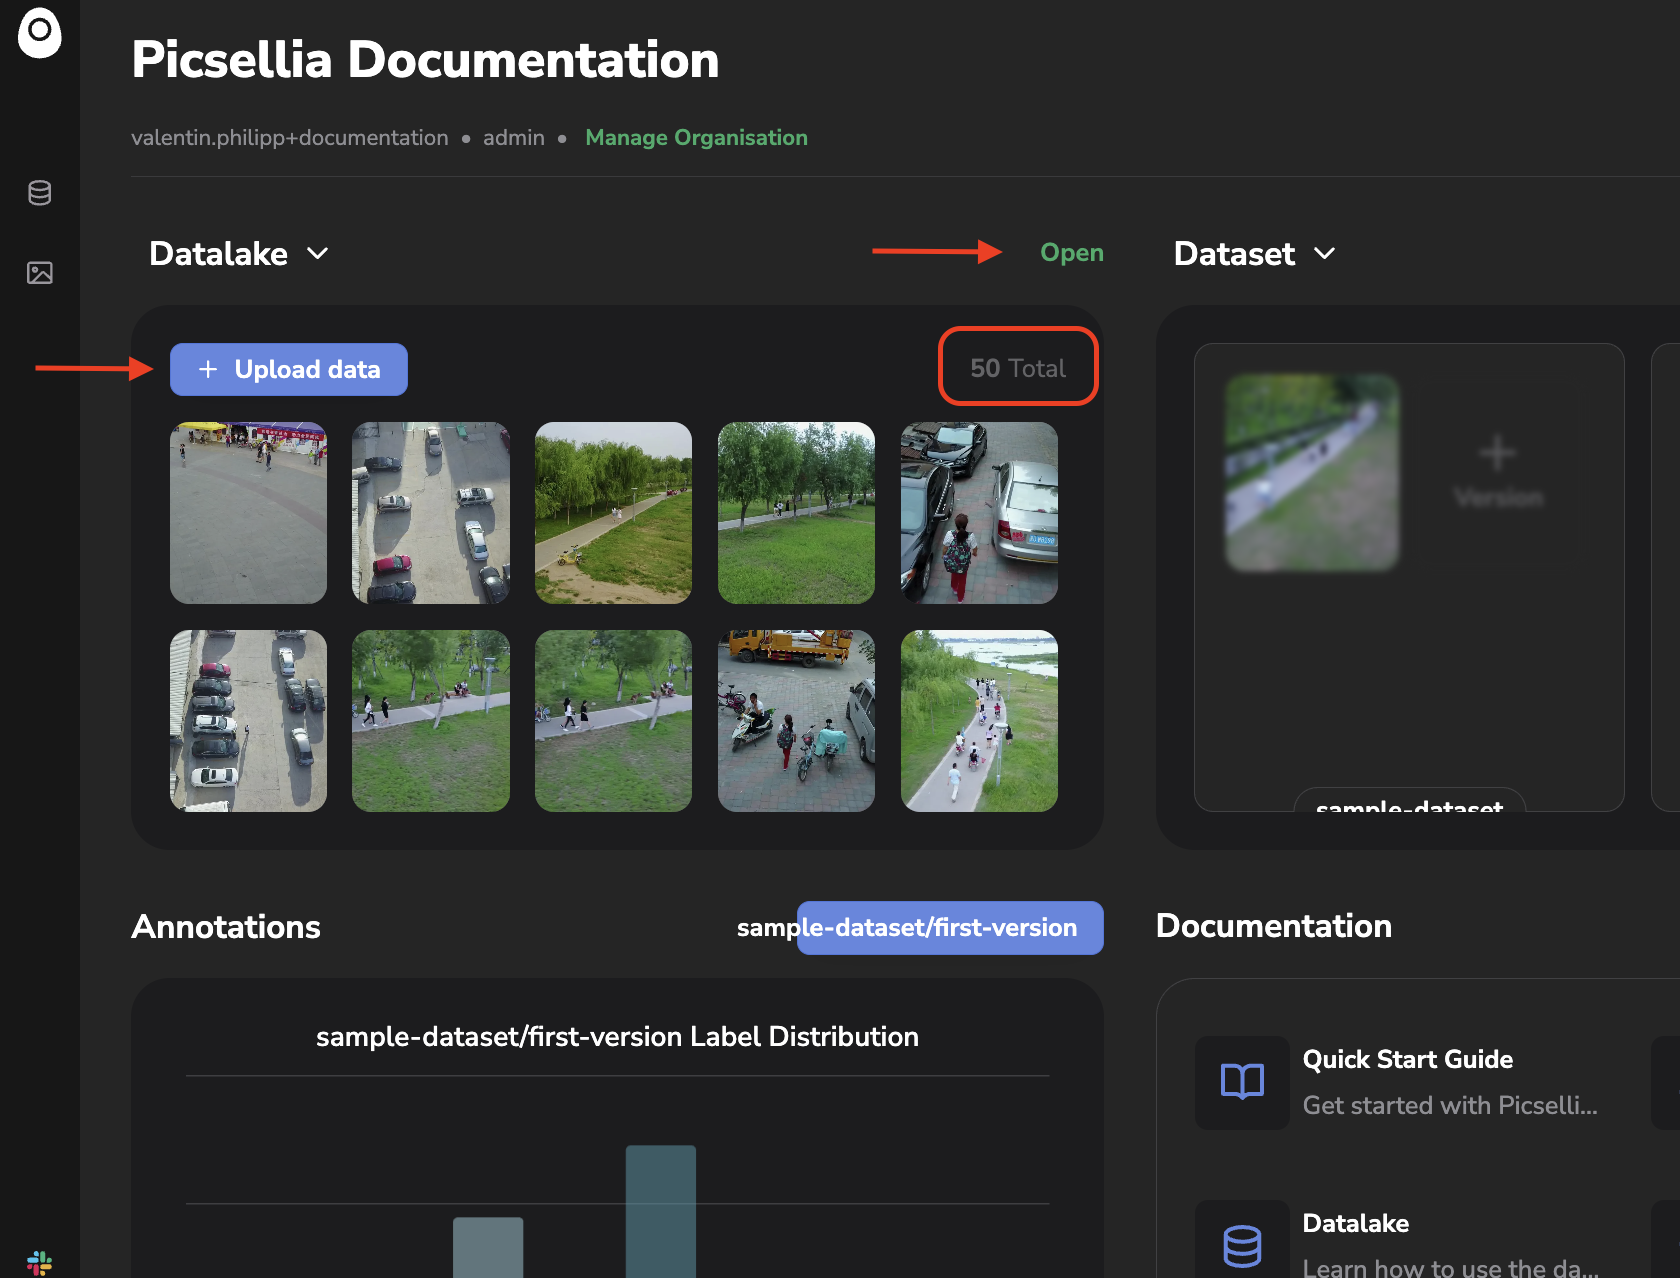
Several Datalake can be related to a give organization, but there is always one that is identified as Default Datalake. The Dashboard displays the latest images uploaded to this Default Datalake, the Open button allows to access the entire Datalake to visualize and explore all its related images, called Data on Picsellia. All the details related to Datalake on Picsellia are available here.
From the Dashboard your can also directly import new images to your Datalake using the Upload Data button. A modal will then open allowing you to select the images to upload. Existing or new DataTag can also be attached during the upload process, more details on the upload process are available here.
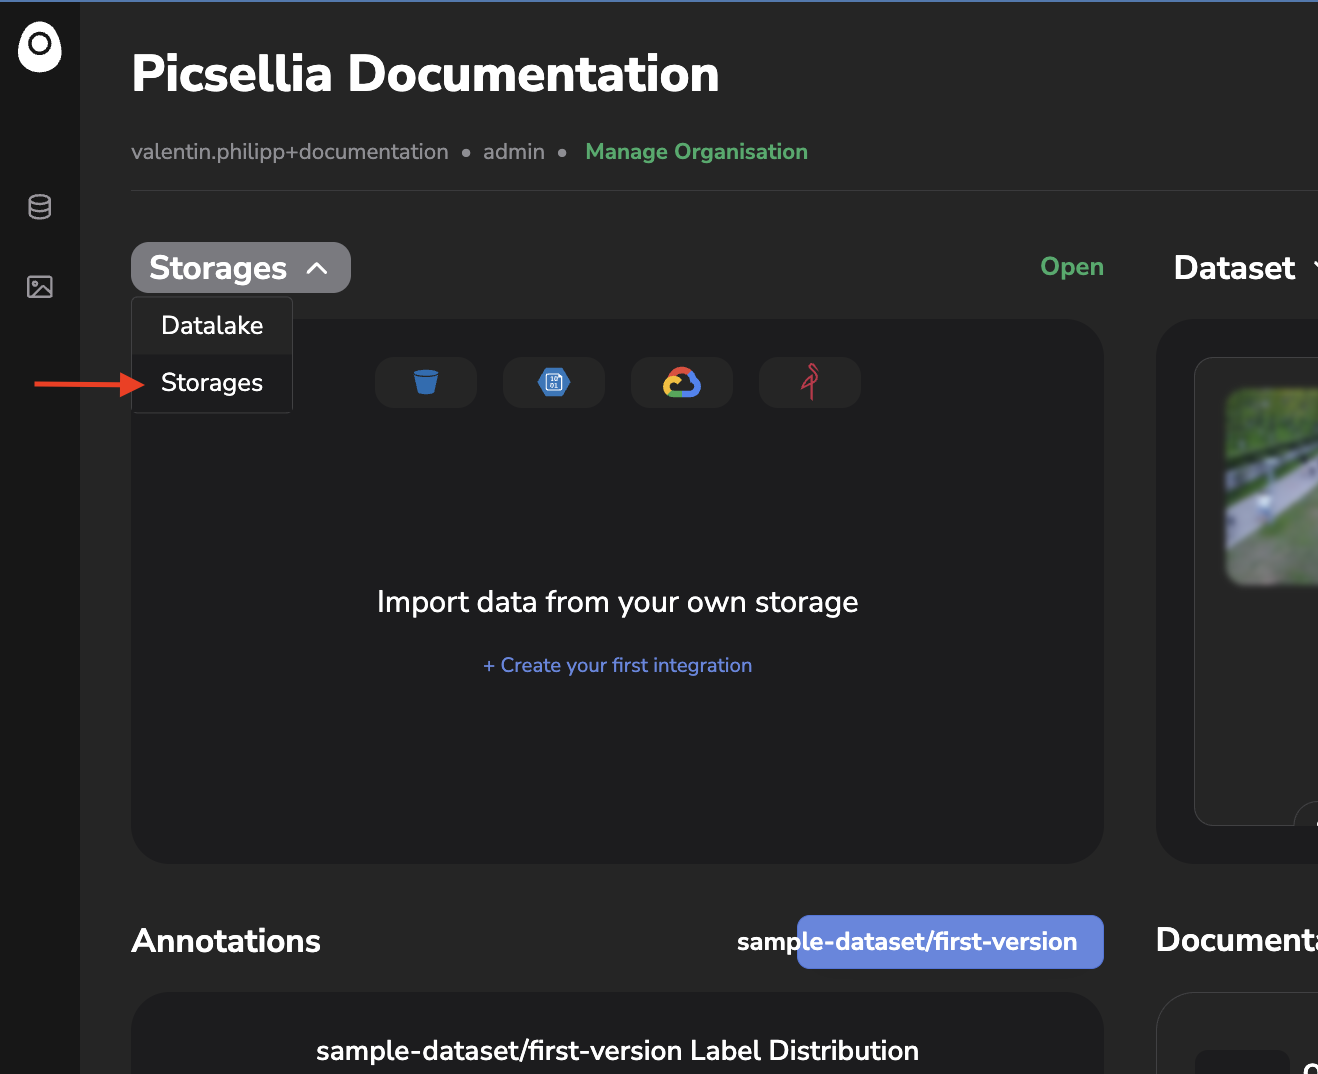
You can also, configure additional Storage Connections by clicking on Storages as shown below:
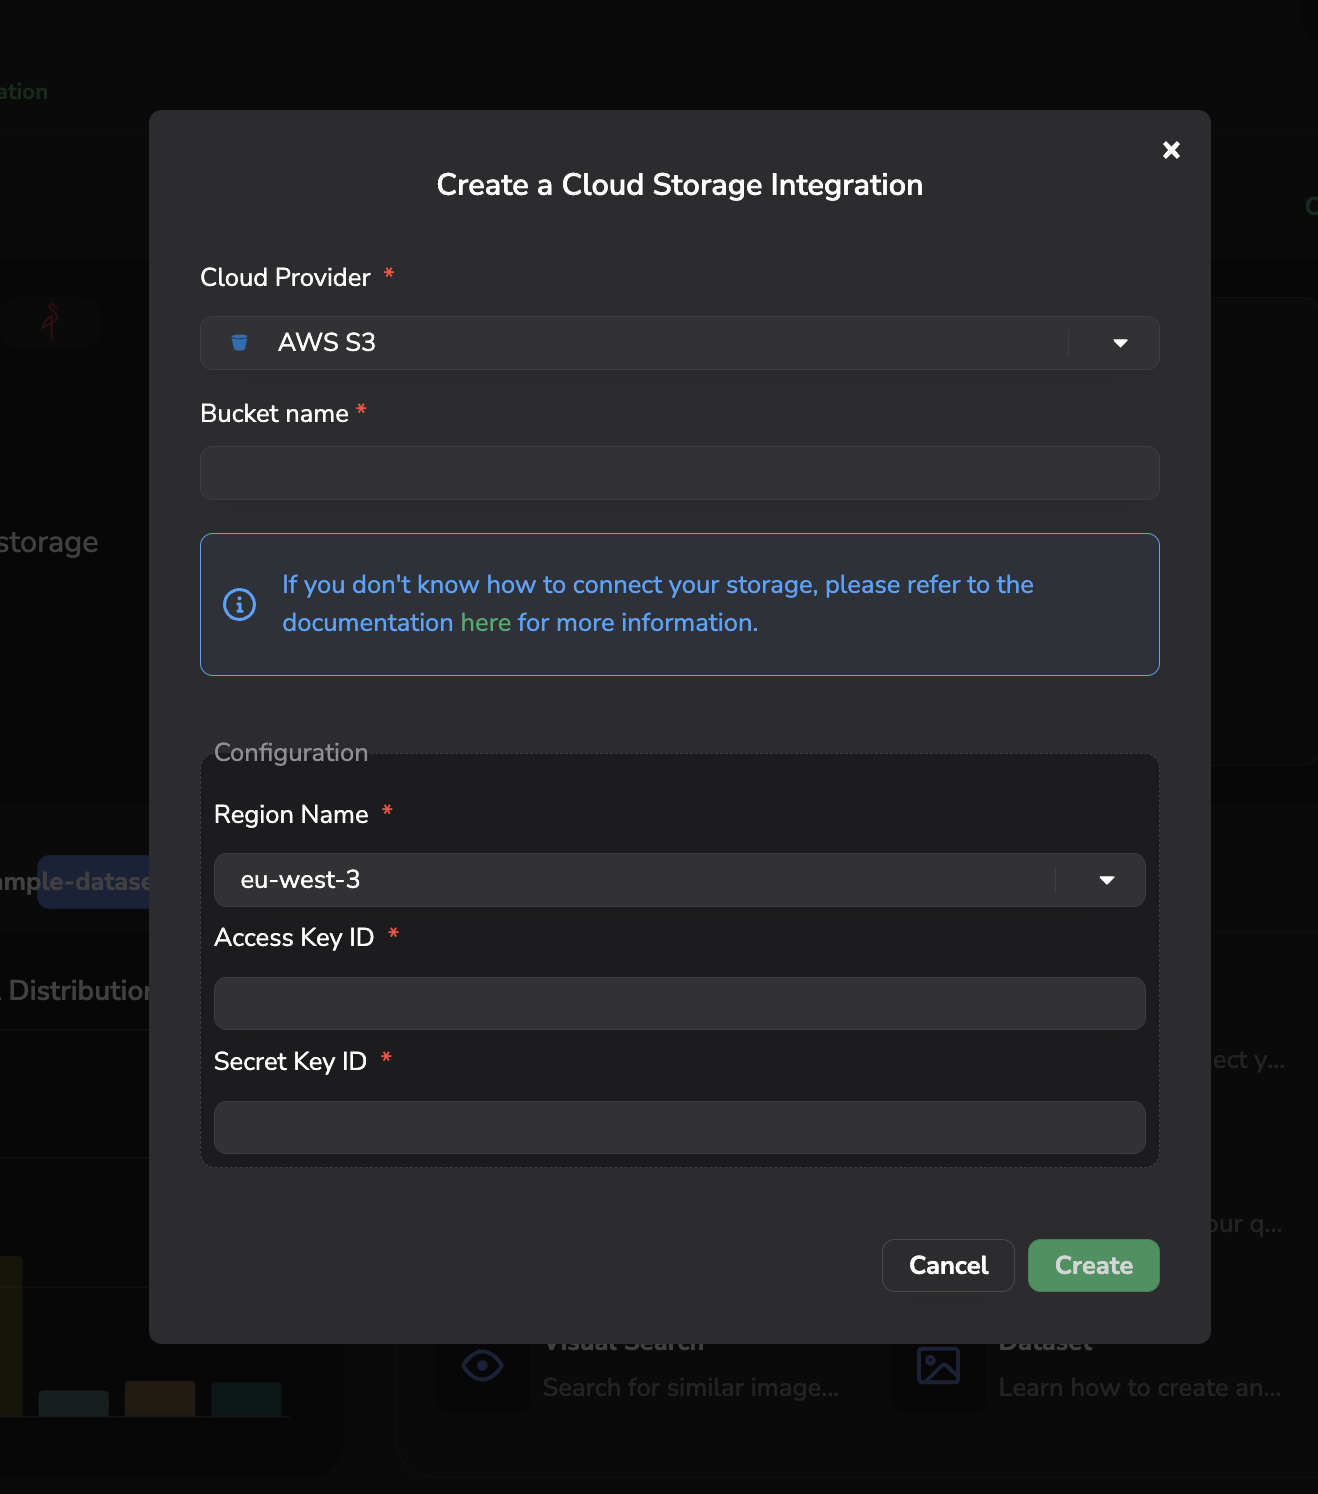
From this view you can create an integration between your own Object Storage and your Picsellia account. To do so, you just need to select the cloud provider hosting your Object Storage and fill the necessary information. A dedicated guide is available here.
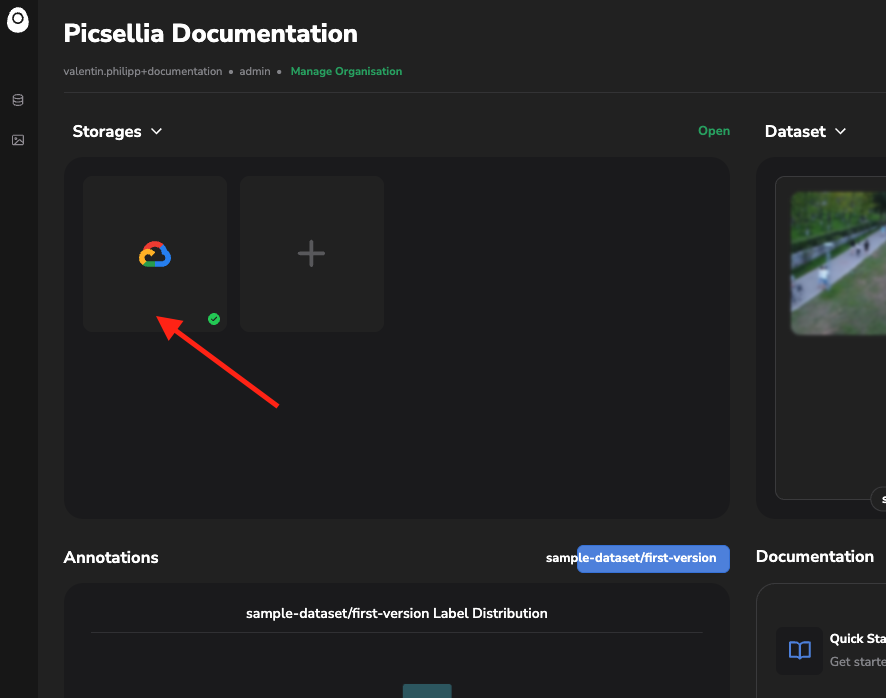
Once the connection is properly setup, a new Storage Connection is displayed as shown below:
If you come back on Datalake, you will then be able either to import images that are already stored on the connected Object Storage or upload images from you local storage, theses images will be then stored by Picsellia on the connected Object Storage and accessible from your Datalake:
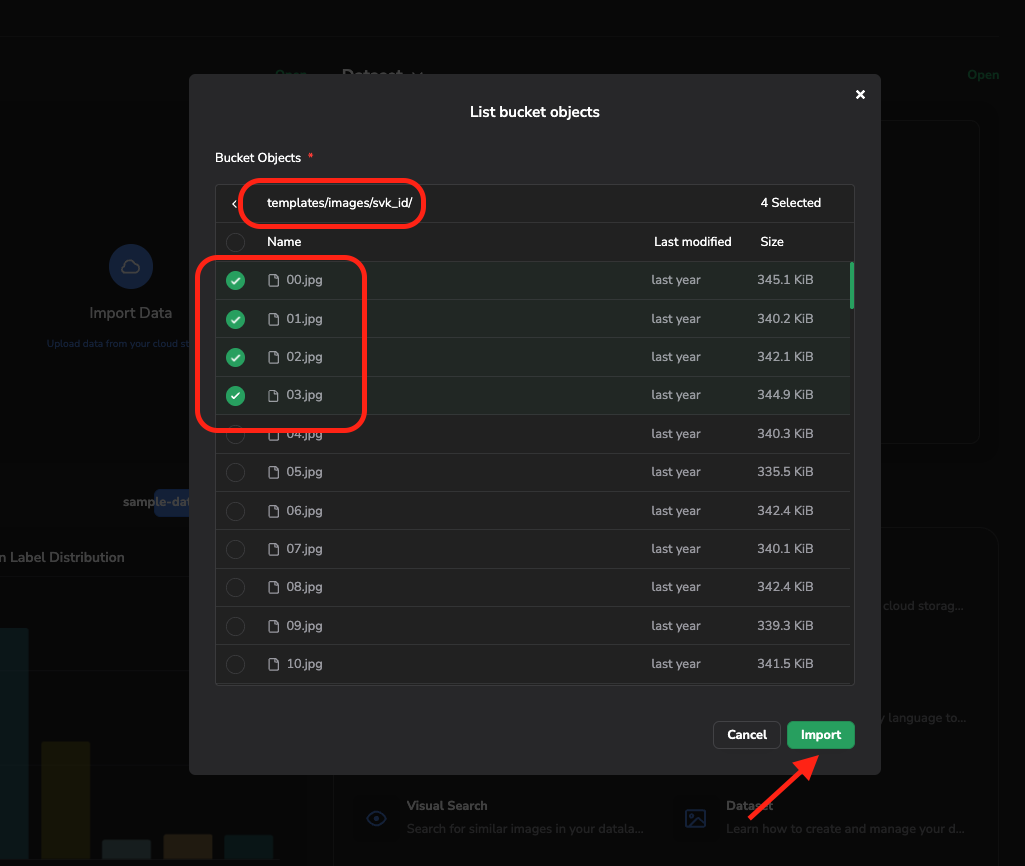
By clicking on Import Data, a modal allowing you to browse your bucket and select the images to be imported will open:
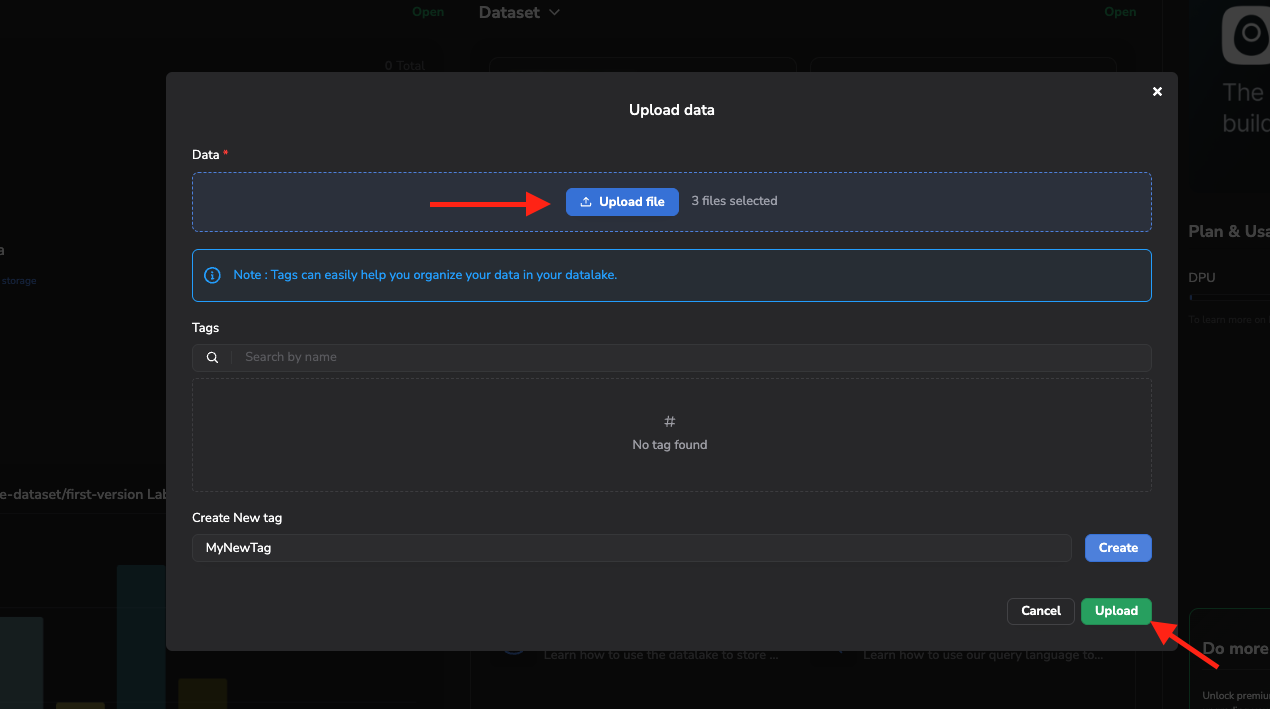
Whereas, clicking on Add New Data will open a modal allowing you to select images to be uploaded from your local drive:
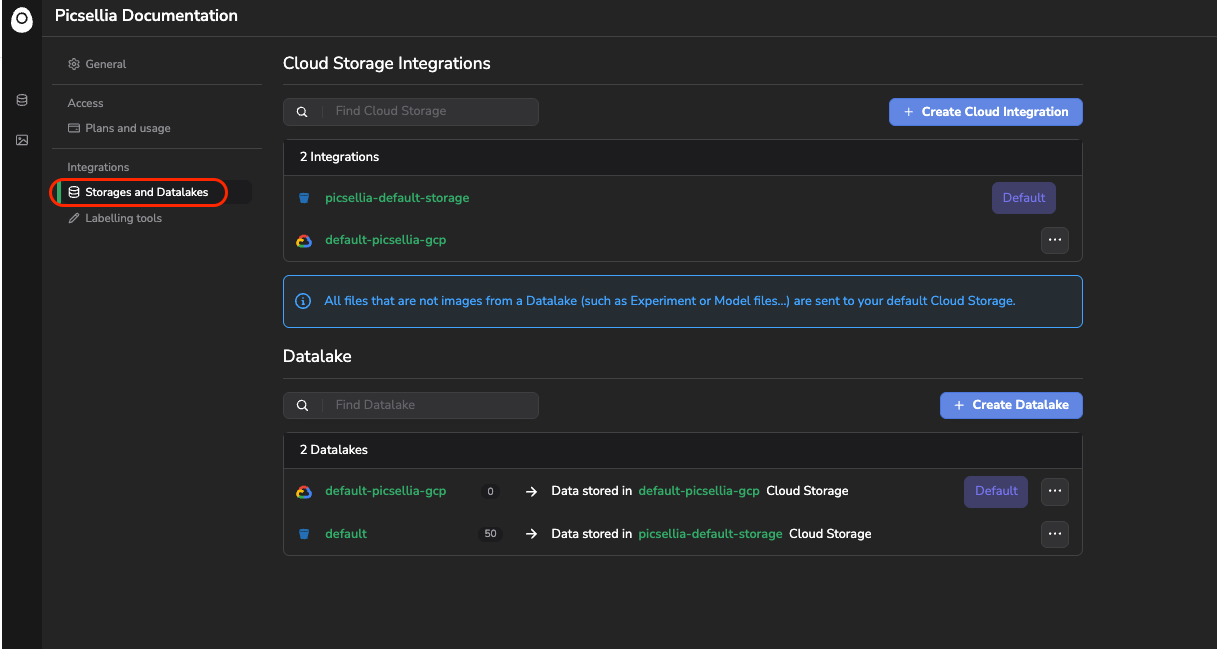
For further configuration on your Storage connection and associated Datalake, you can click on Manage Organization and access the Storages and Datalake tab:
As a conclusion, from the Dashboard you can manage your Storages and have an quick overviews on the Data already imported in the associated Datalake. Any further manipulation on Data can be done by accessing directly the Datalake feature from the navigation bar. The exhaustive documentation of the Datalake is avaiable here.
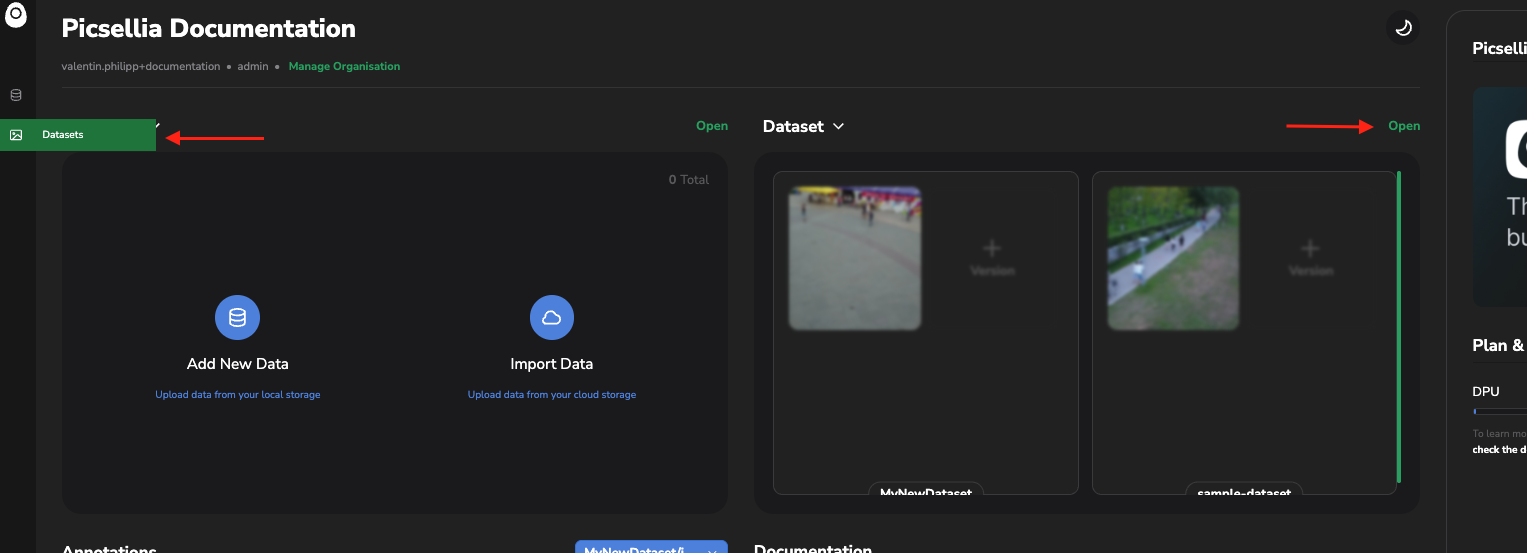
5. Dataset
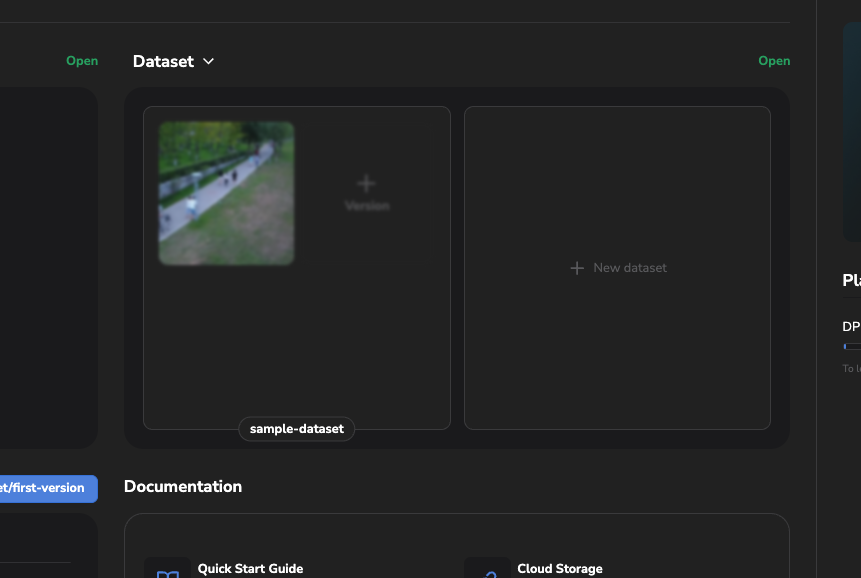
The Dataset part offer a comprehensive view of up to the two latest Dataset created in your Organization.
For each Dataset displayed, up to the 4 latests DatasetVersion are displayed. The Picsellia Dataset versioning system is explained in details here
In the below example, one Dataset lies in my Organization and this one has only one DatasetVersion:
By cliking on the preview of any Dataset or DatasetVersion, the selected objet will open allowing you to perform further manipulation on it such as creating new DatasetVersion, create a fork, annotate, process and so on. The documentation related to Dataset and DatasetVersion manipulations starts here.
Neverthess, Dataset or DatasetVersion creation is available directly from the Dashboard. By cliking on "+ Version" on a given Dataset:
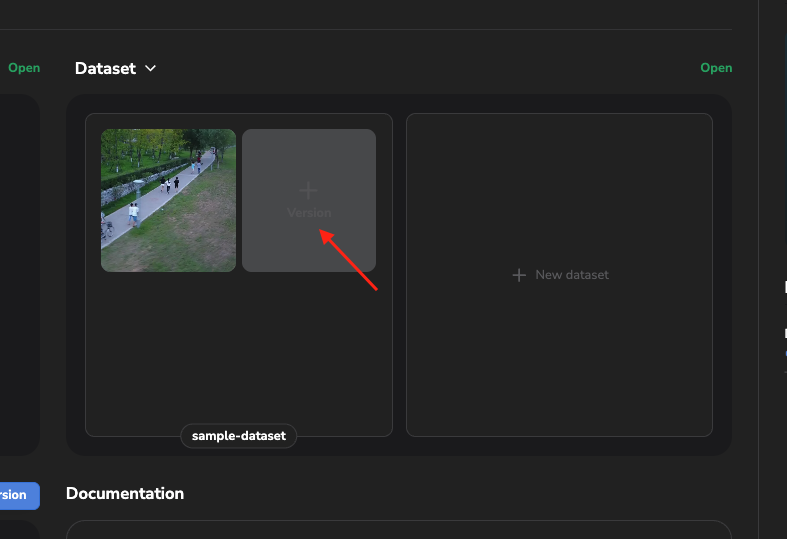
A modal will open allowing you to configure this new DatasetVersion (Name and Description) and select the Data among you Datalakethat will compose this new one. Please note that form this modal, you can switch between your Datalake and filter among the Data using the Query Langage detailed here.

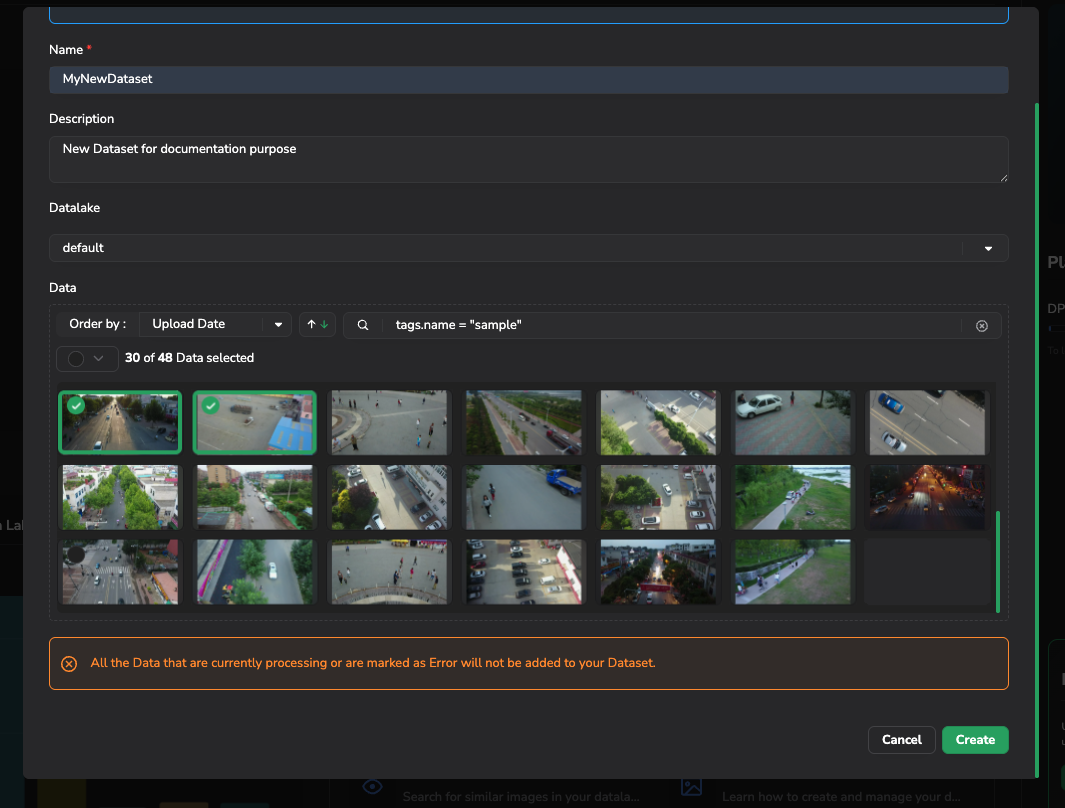
You can also create a brand new Dataset by clicking on + New Dataset as shown below:
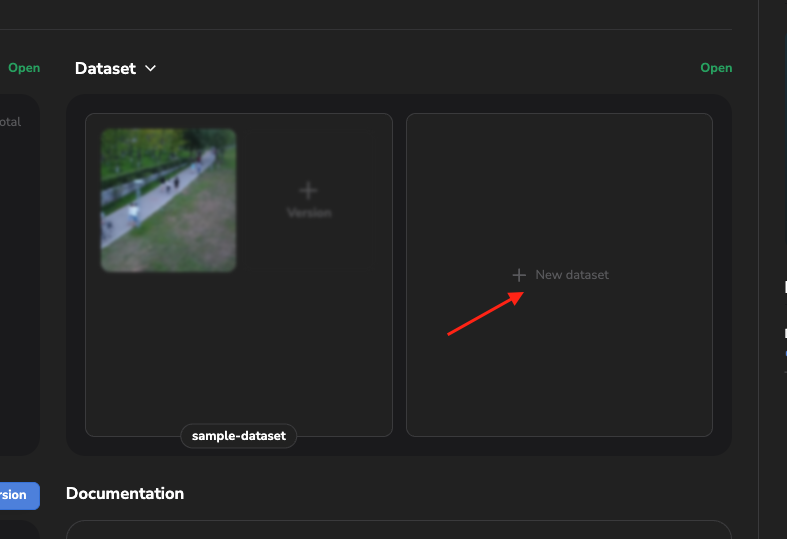
This will also open a modal allowing you to prompt the name of this new Dataset and select the Data that will compose its first DatasetVersion which will be automatically be created and named Initial. Here again, llease note that form this modal, you can switch between your Datalake and filter among the Data using the Query Langage detailed here:
From the Dashboard you can then quickly create new Dataset or DatasetVersion but by clicking on Open or using the navigation bar you can reach the proper Dataset Versioning management system.
6. Annotations
From the Dashboard, you can also visualize the repartition of existing Annotation among the different DatasetVersion as shown below:
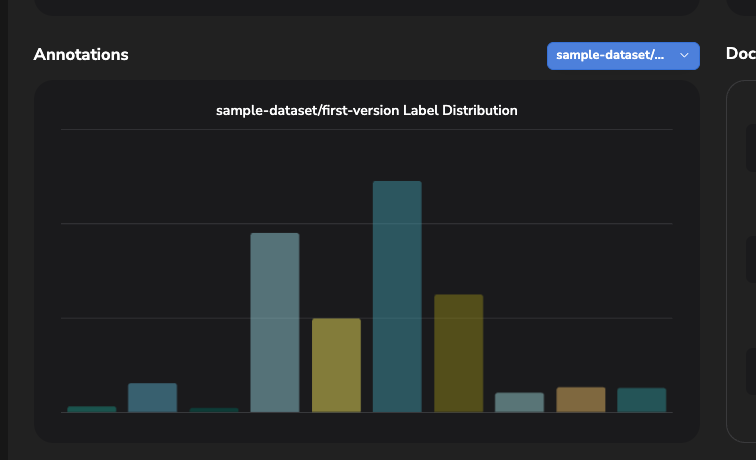
You can select the DatasetVersion you are interested in and for each one displayed, you can hover on the bar chart to visualize the number of Object per Label among all the Asset composing the selected DatasetVersion:
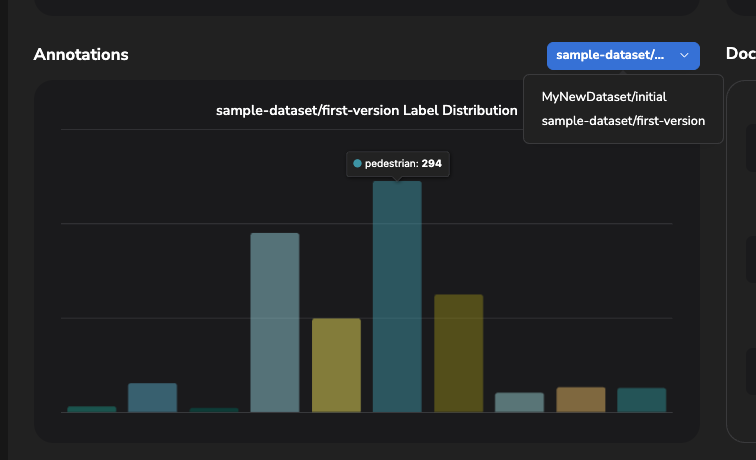
On this example, the DatasetVersion first-version has 294 Object with the Label "pedestrian". Once again for further manipulations on a DatasetVersion, you should access the Dataset feature from the navigation bar.
In case, the selected DatasetVersion has no Annotation yet, you will be able to either:
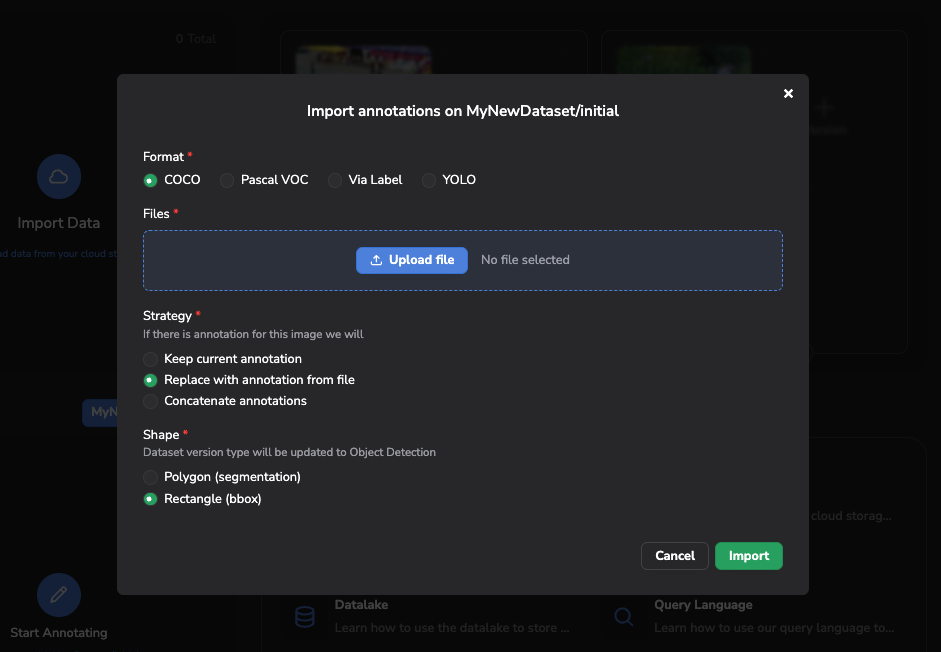
- Import your annotation file if you have one by cliking on Import Annotation. A modal will then open allowing you to select the annotation file and configure the import.
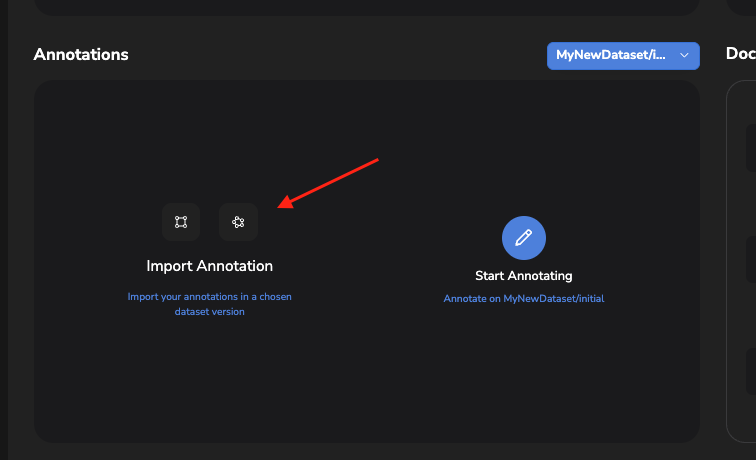
- Access the Annotation Tool, to start creating your own annotations though Picsellia. The extended documentation of the Annotation Tool is available here. Please note that you need to define the Annotation Type and a list of Label before starting annotating, this can be done directly in the Annotation Tool or by following this guide.
Updated about 1 year ago