DatasetVersion - Explore your Assets and Shapes with Embeddings
Explore your images and shapes with embeddings in Picsellia's DatasetVersion. Learn about similarity search, text-to-image search, and UMAP projections.
The Picsellia DatasetVersion offers several features that rely on the embeddings that are computed for each image and shape, those features allow a smooth and efficient exploration of a large volume of images or shapes based on mathematical methods.
Basically, this feature works the same way as for Datalake embeddings exploration. In the DatasetVersion view, you'll also have the ability to compute one embedding per Shape created on any Asset. It will unlock the exploration of Shape embeddings to identify Shape clusters and annotation mistakes, for instance.
In detail, based on the embeddings computation, in a given DatasetVersion, you'll be able to:
- Perform similarity search on
AssetsandShapes - Query your
AssetsorShapeswith the Text-to-image search - Explore your
AssetsandShapesin depth with the integrated UMAP projections map
1. How to configure it?
First of all, before using the features that rely on the embeddings computed for your images or shapes, you need to activate this computation for Asset and Shapes, knowing that both can be activated independently.
To do so, you need to access the DatasetVersion settings, especially the Visual Search tab.
You need to have the Admin rights on the current
DatasetVersionto access its Settings page
Please note that the embeddings computation is DatasetVersion related, meaning that if you have several DatasetVersion, you'll need to perform these activations for every DatasetVersion.
A. Image embeddings
To activate the Visual Search feature on the images of the current DatasetVersion, you need to access its settings page, especially the Image Embeddings tab, and click on Activate:
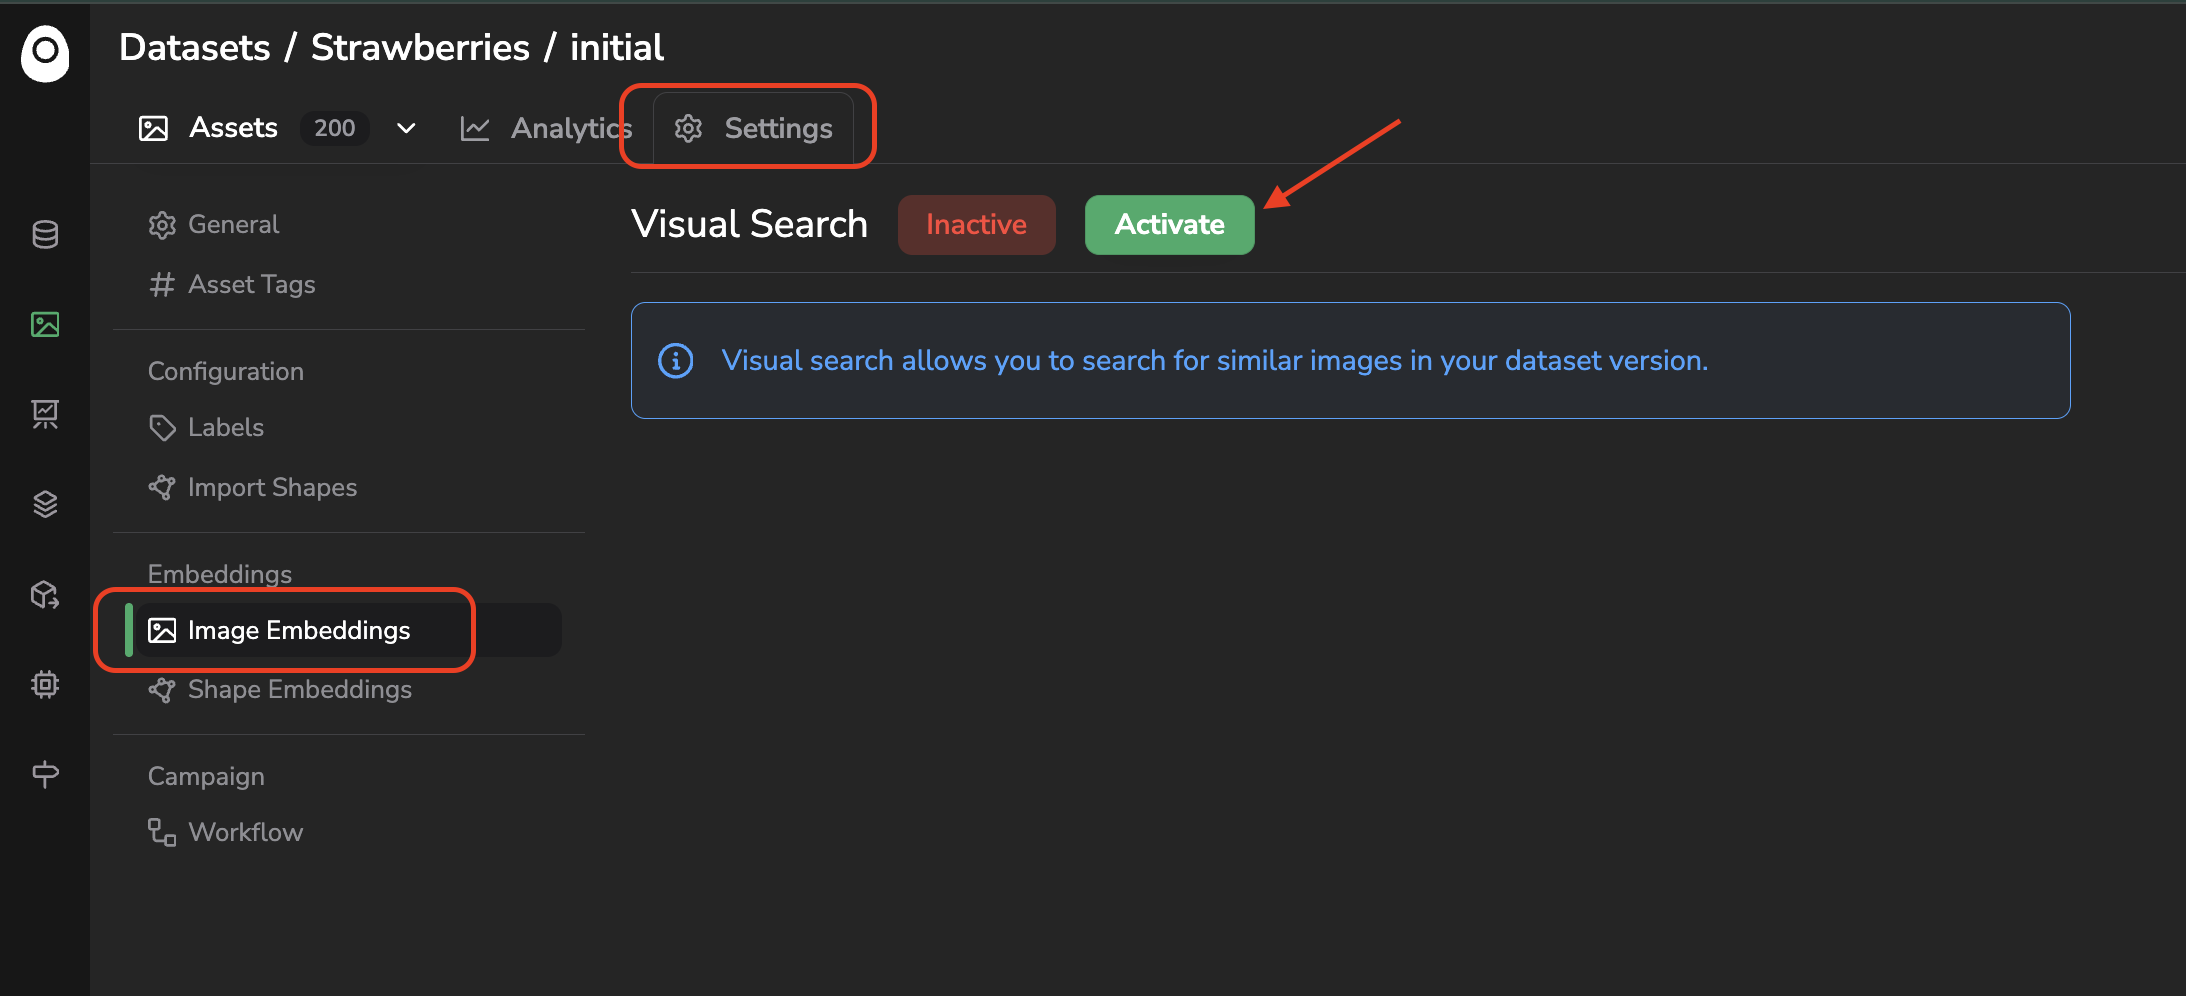
Access the Visual Search configuration page for images
B. Shape Embeddings
To activate the Visual Search feature on the images of the current DatasetVersion, you need to access its settings page, especially the Shape Embeddings tab, and click on Activate:
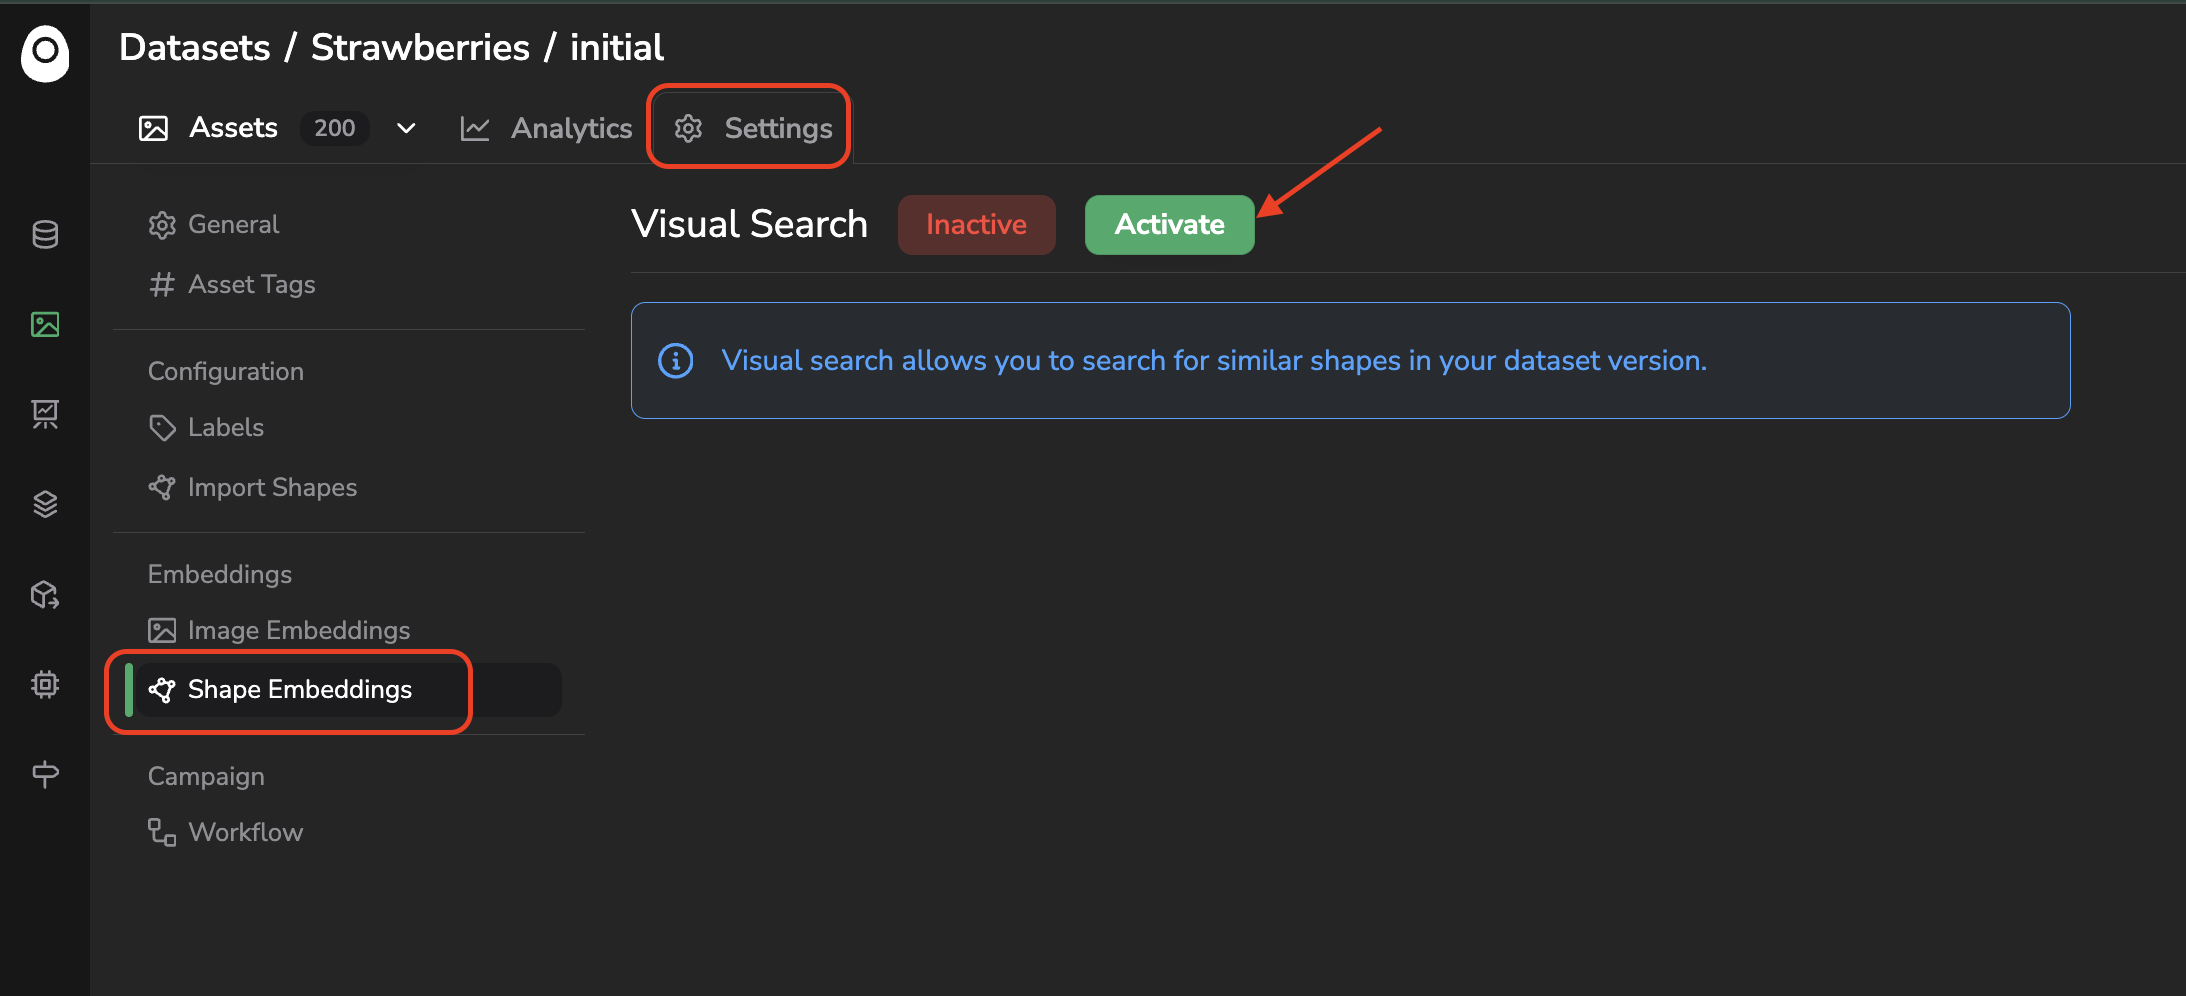
Access the Visual Search configuration page for shapes
Obviously, to compute shape embeddings, the Asset of the current DatasetVersion must have been annotated first, no matter how (annotation file import, annotation studio, annotation campaign, pre-annotation processing...).
C. Embeddings computation status
Once activated, the computation process and configuration work basically the same for images and shapes. The computation will start, it can be tracked thanks to the progress bar or directly from the related internal Job created and accessible in the Jobs tab.
A prerequisite to compute the image embeddings in a
DatasetVersionis to have activated on the Datalake the images are from. As a consequence the image embeddings have already been computed by the Datalake Visual Search feature and the computation for images only will be almost instant.
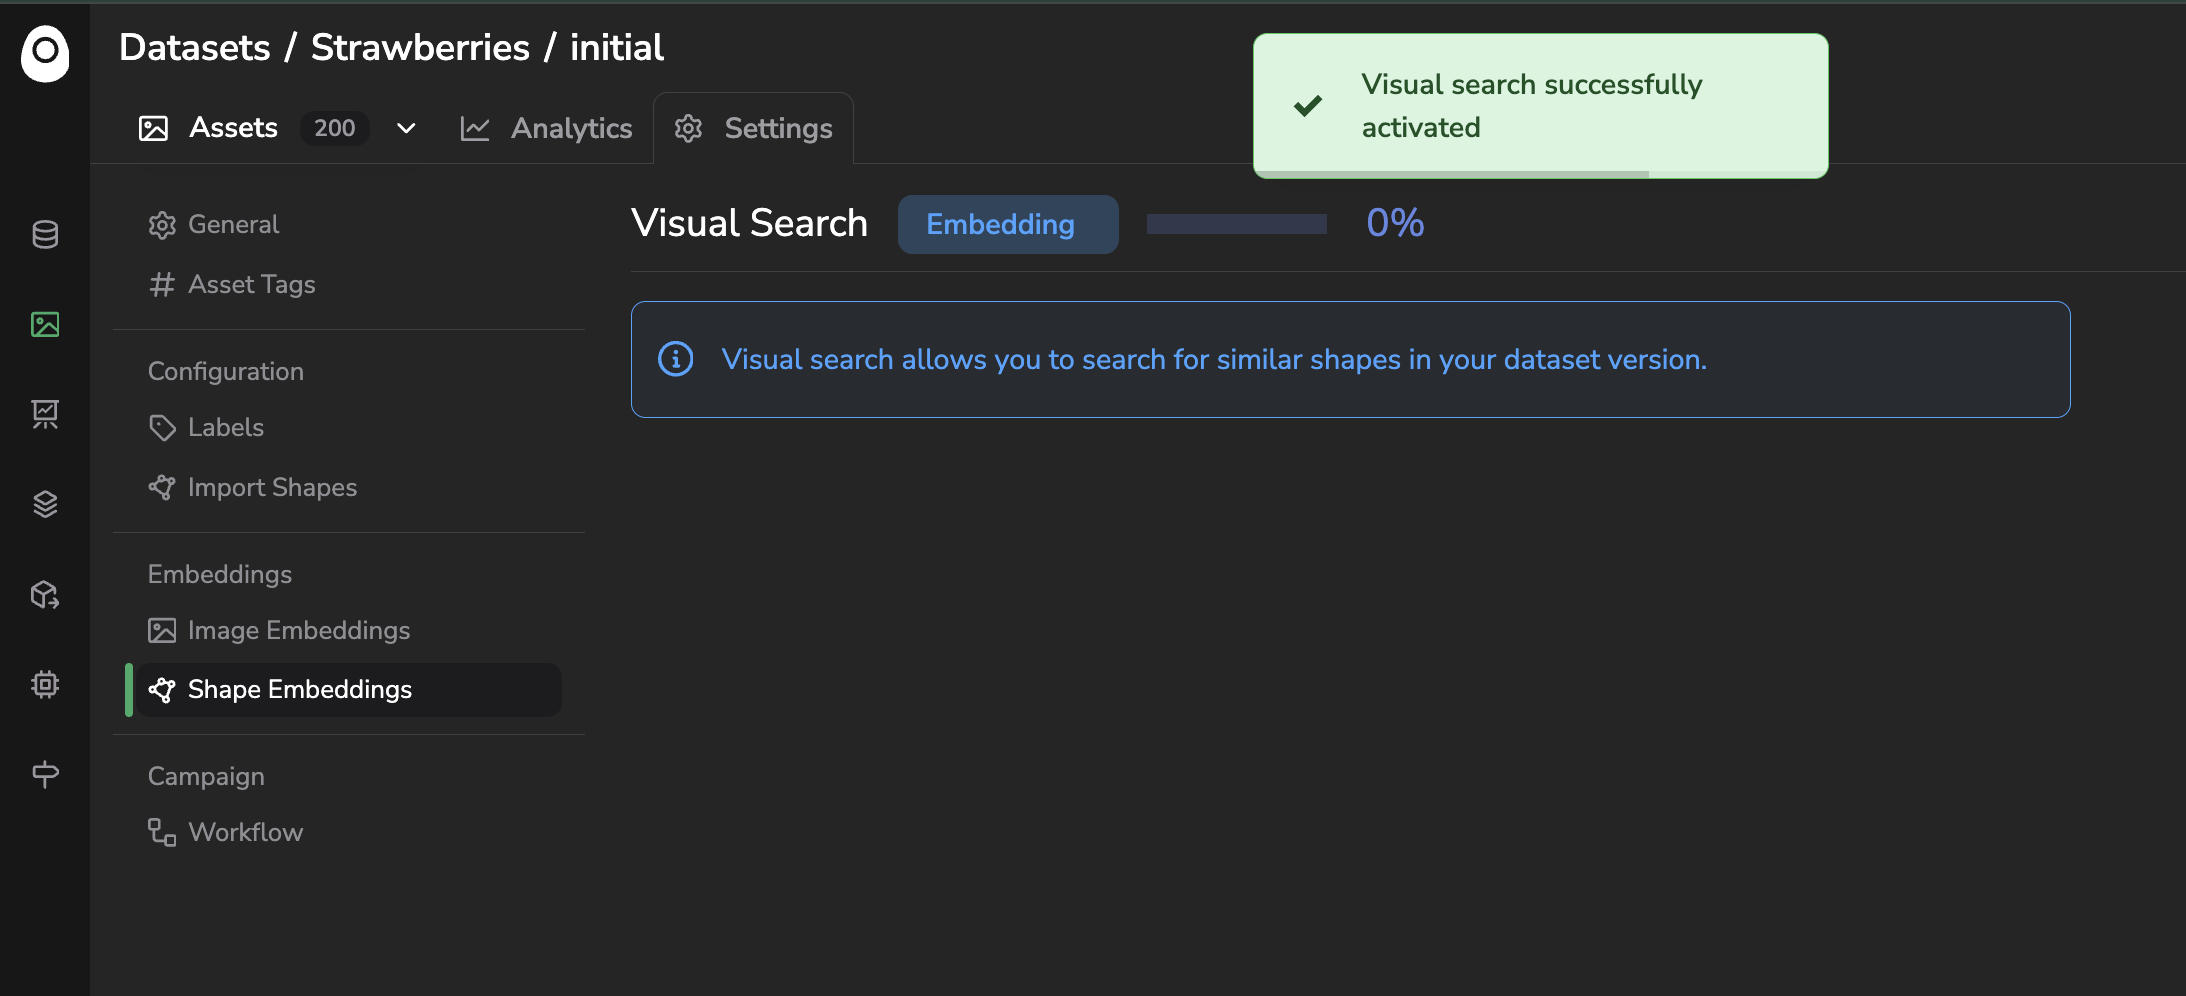
Activation of the Visual Search for shapes
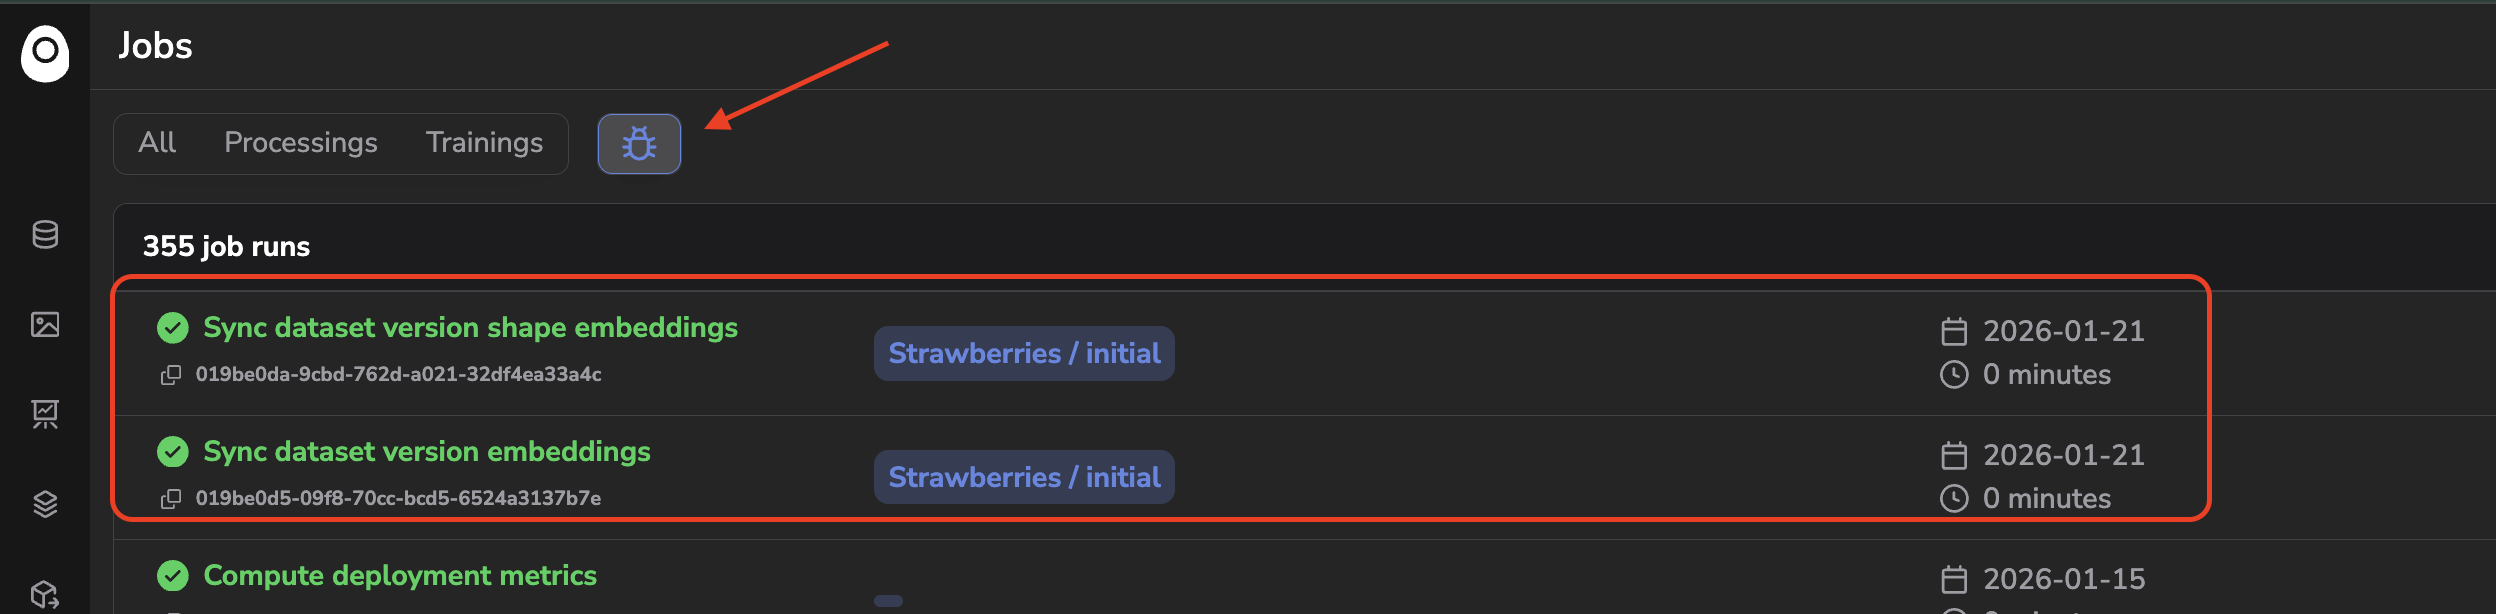
Embeddings computation job for images and shapes
Once the computation is over, you'll have access to an embeddings status overview that details the number of images or shapes treated successfully and also the ones that have not been computed for any reason:
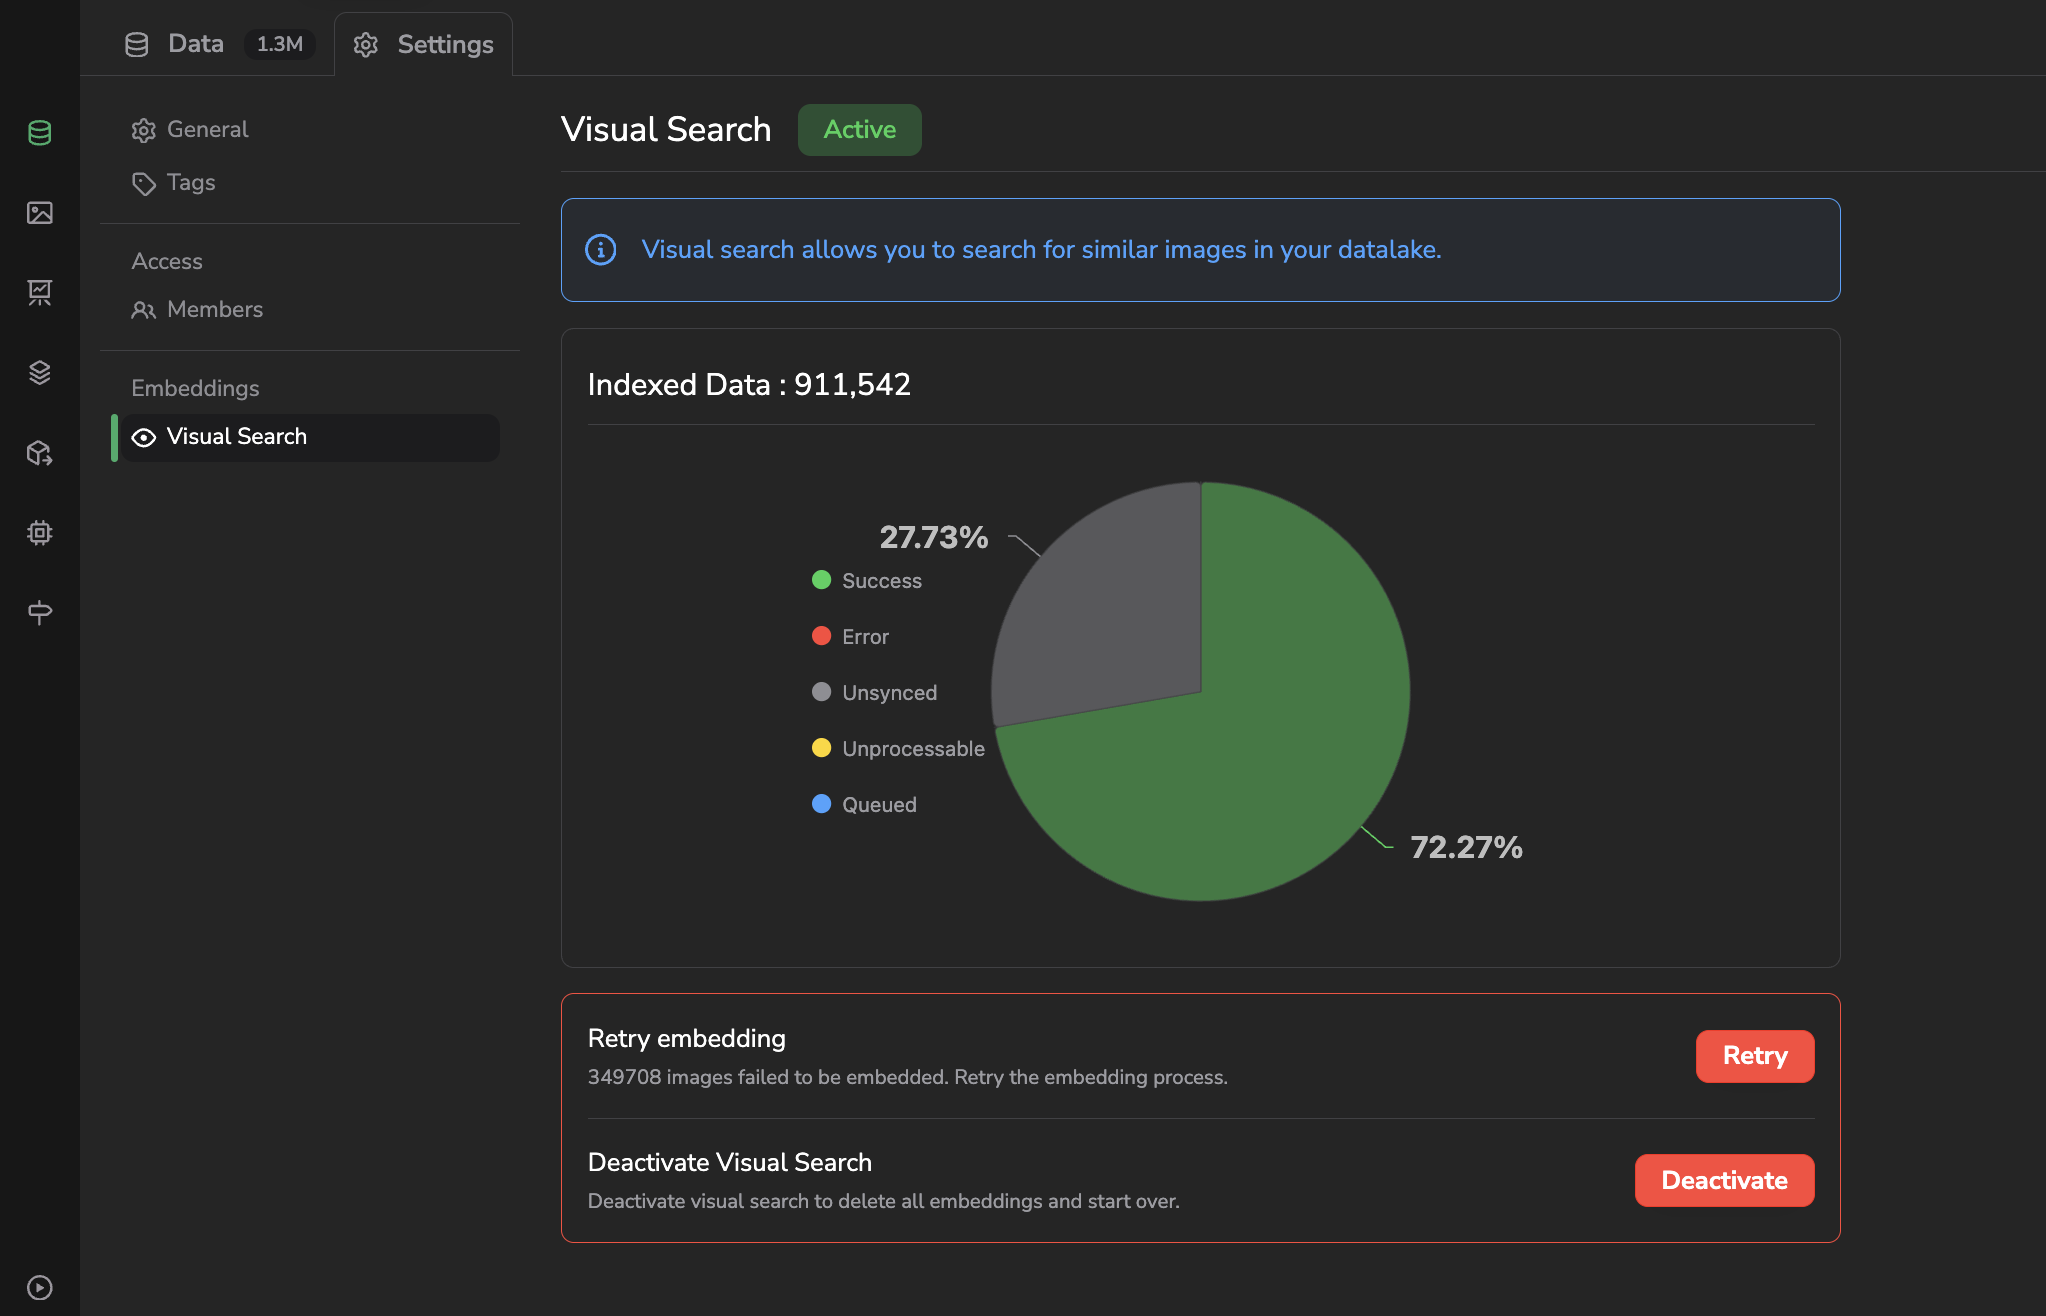
Embeddings computation overview
As shown in the above screenshot, some images or shapes may not be computed due to an isolated issue during the computation process or because they are not in a supported format. In both cases, you can relaunch the embeddings computation for all the images or shapes that are in a given status using the Retry button:
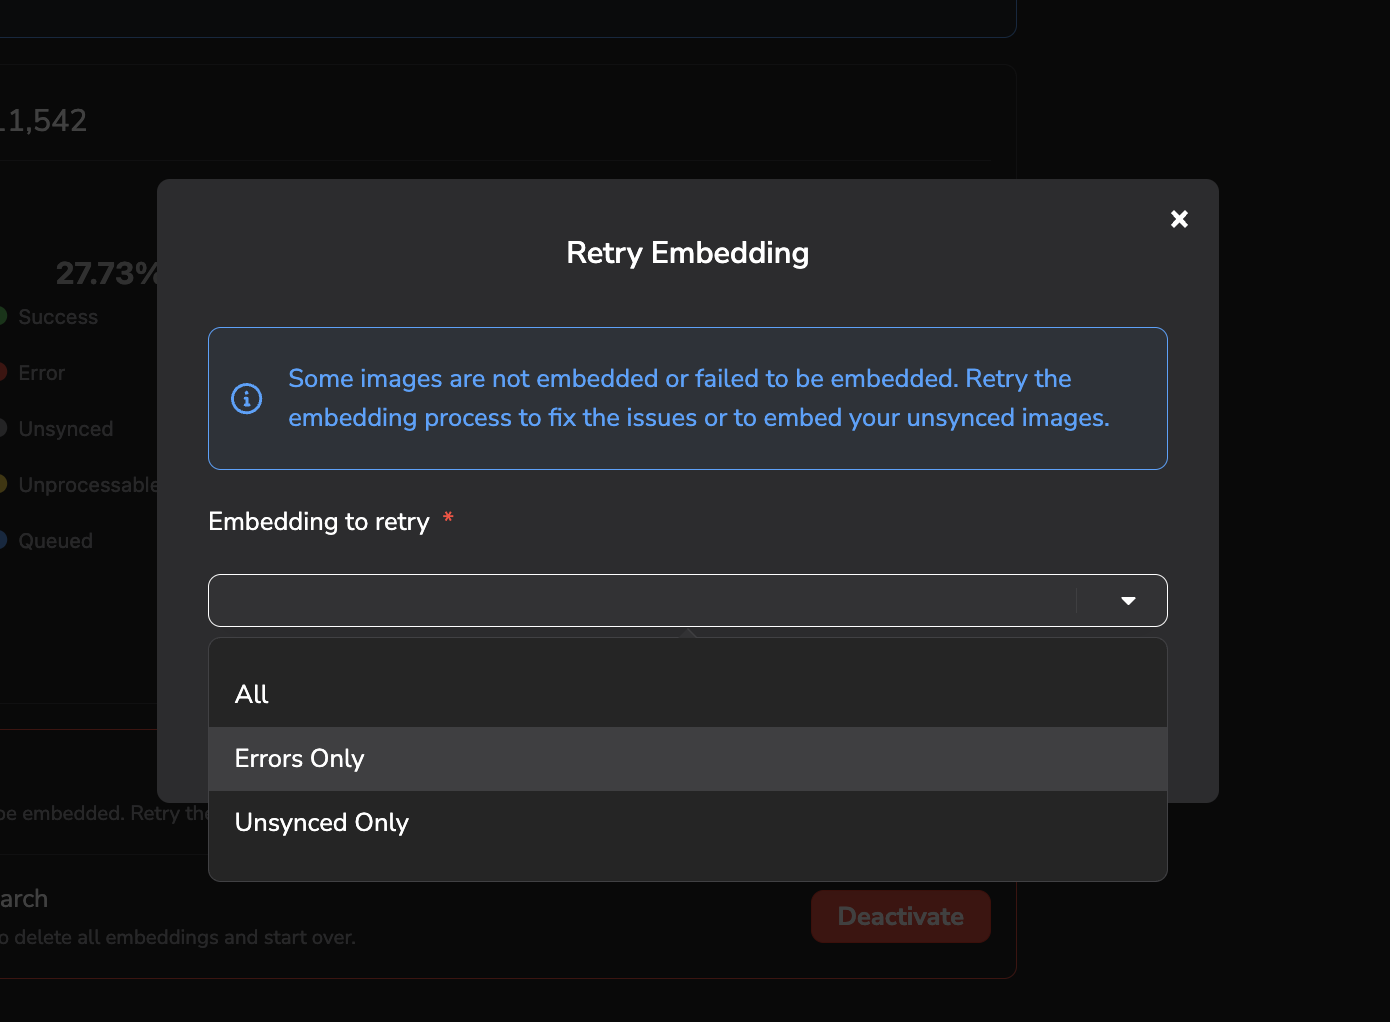
Retry embeddings computation
Once the computation is over, the Active flag appears. This means that from now on, each new image or shape added to the current DatasetVersion will, if possible, be computed to generate an embedding from this one.
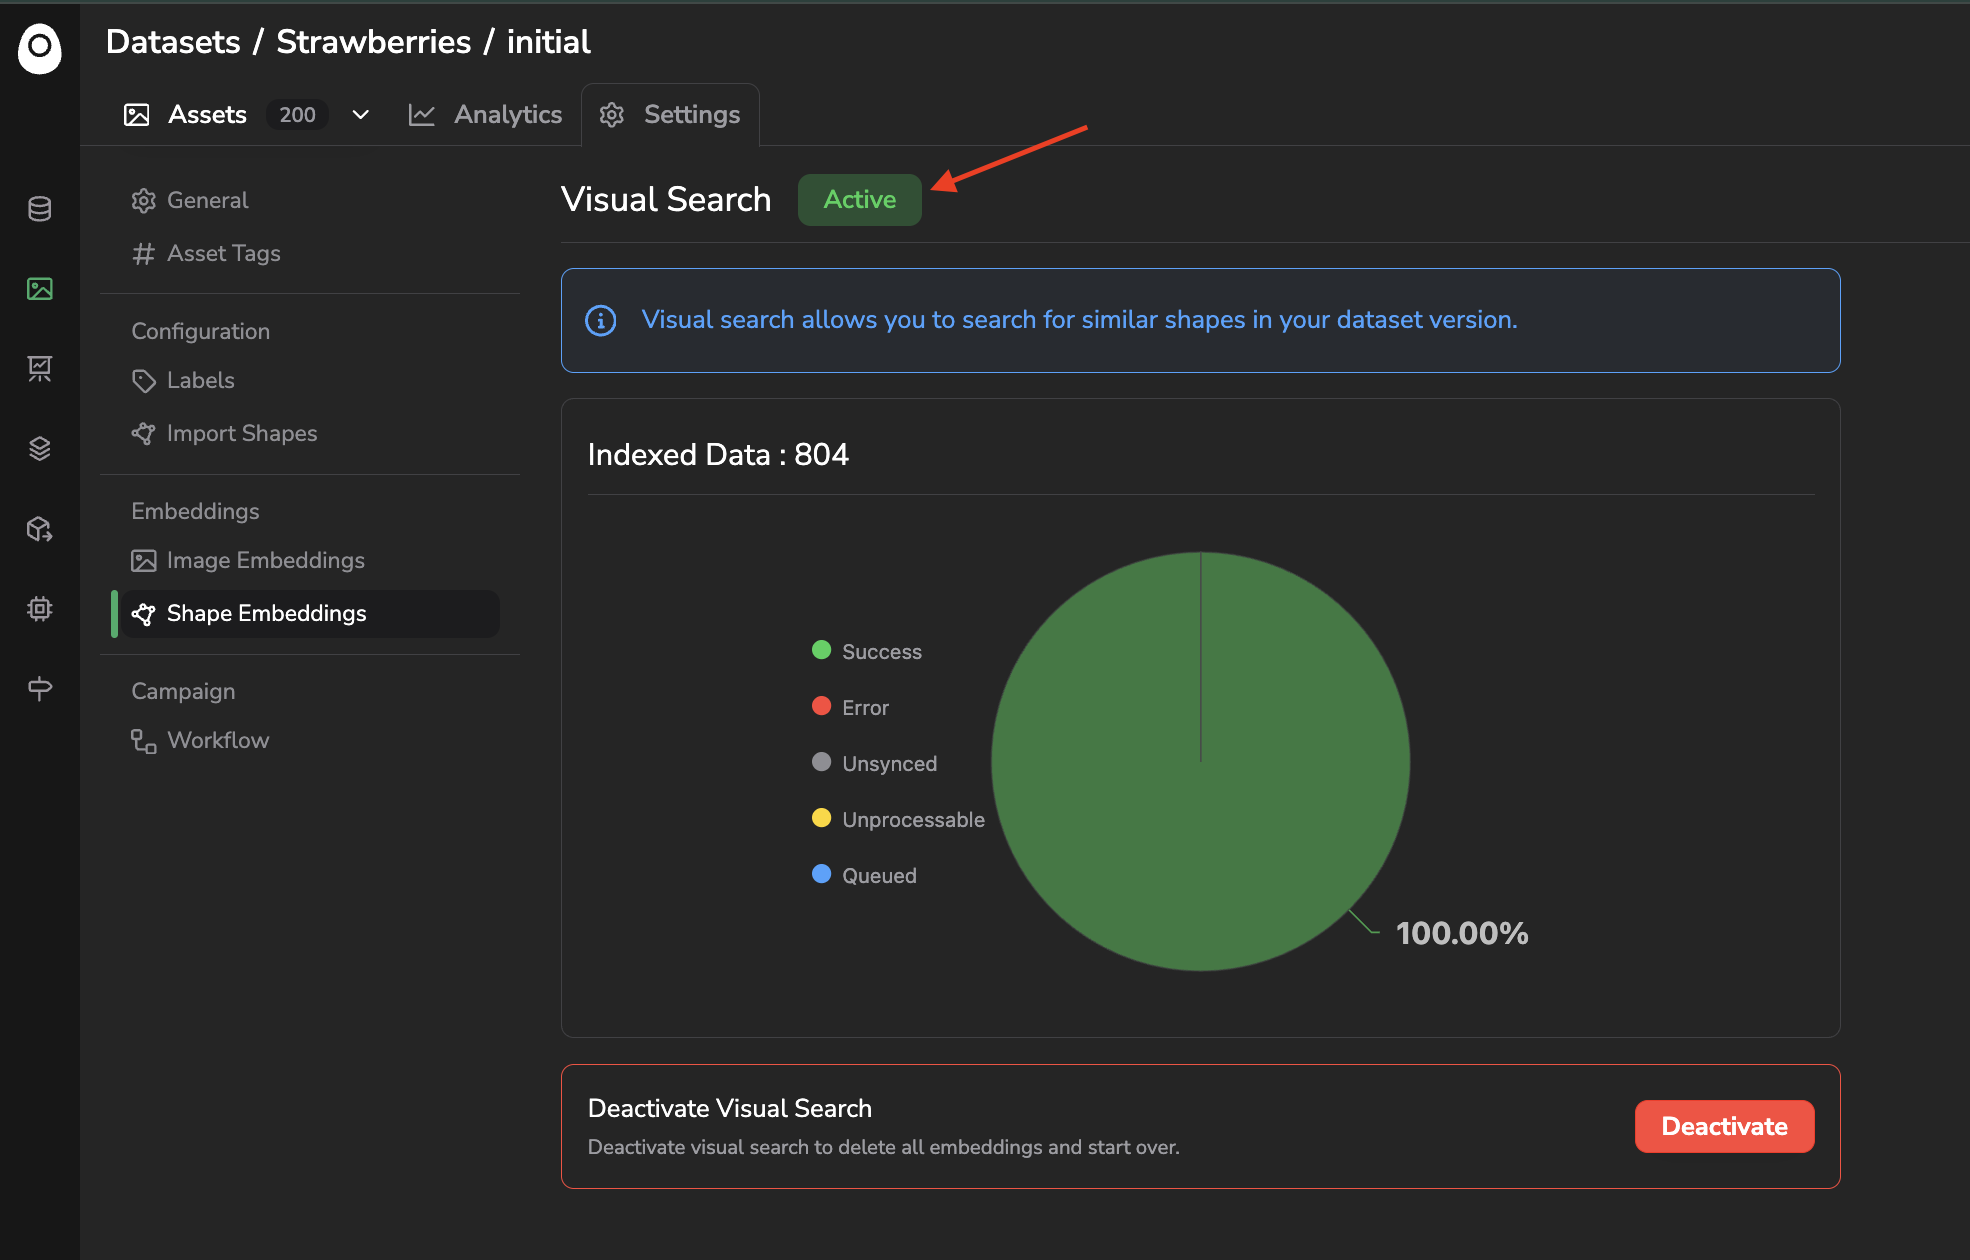
Visual Search feature status
Please also note that you can deactivate the embeddings computation at any moment by clicking on Deactivate, this will, as a consequence, delete all the embeddings already computed for the current DatasetVersion so please be very cautious while using this button.
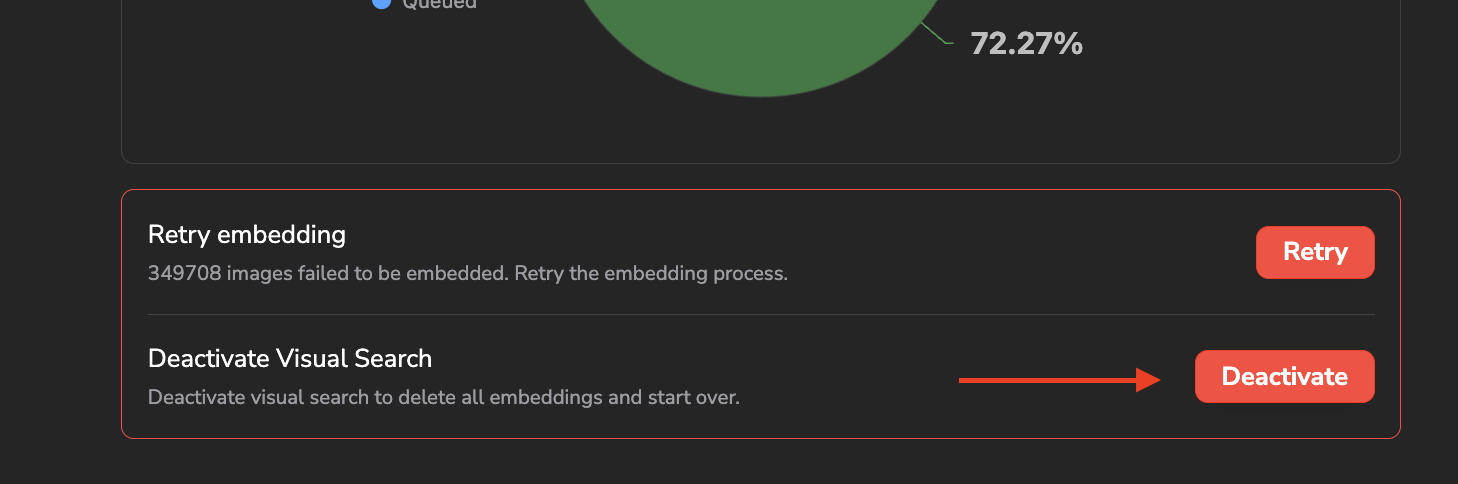
Visual Search deactivation
Let's talk quickly about the technologies that are used behind this embeddings computation.
Basically, it is the library open_clip that is used to generate one embedding vector per image or shape. In particular, it is the model ViT-B-16 with the weightsdatacomp_xl_s13b_b90k that are used by default. Once generated, each embedding vector is stored in a QDrant Vector Database and especially the Vector Search Engine to implement the different exploration features that will be detailed below.
Use your own embeddings model ?
The Picsellia embeddings system has been build by design to handle any type of embeddings model, so if you want to use your own model to compute the embeddings of your
DatasetVersion, please reach out the Picsellia team in order to setup this specific configuration.In case you need more then a generic OpenClip model to compute and explore your embeddings, you can also leverage the Experiment Tracking feature of Picsellia to fine-tune the generic OpenClip model on your own images and captions. This would then allow you to quickly train and integrate an embedding model that generates insightfull vectors in your particular context. For that need also, please reach out the Picsellia team to proceed.
Now that the Visual Search feature is fully activated and the embeddings computation is over, let's detail together the different features that will leverage them to perform image or shape exploration.
2. Similarity Search
The first and most common way to leverage the embeddings is through Similarity Search. Basically, it allows identifying the images or shapes that look the most like the selected one.
To find the X more similar image or shapes from your DatasetVersion for a selected one, you just need to select it directly among your DatasetVersion, click on Find Similar, type the number of most similar images to search for, and click on Search.
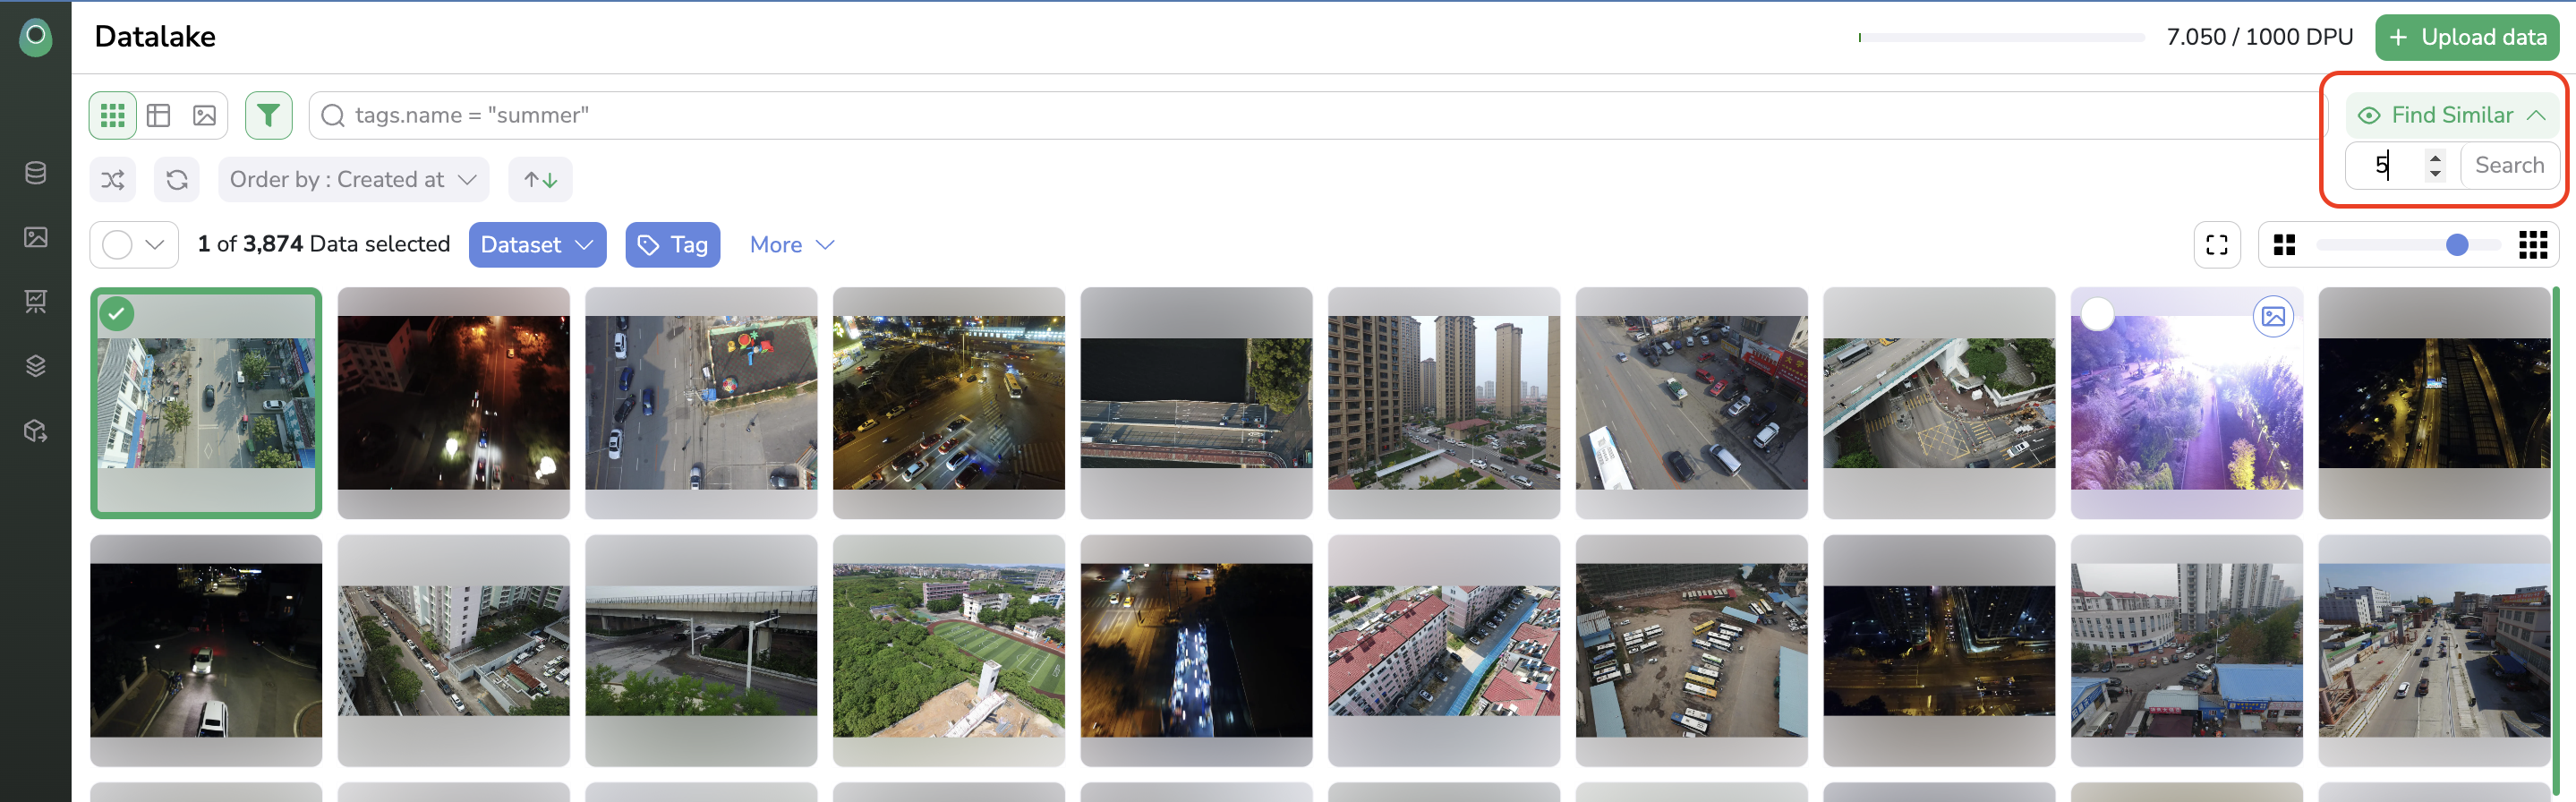
Use Similarity Search
The Similarity Search button is accessible only if one image is selected
Once, more similar images are found by Picsellia, they will be displayed in the DatasetVersion overview as shown below:
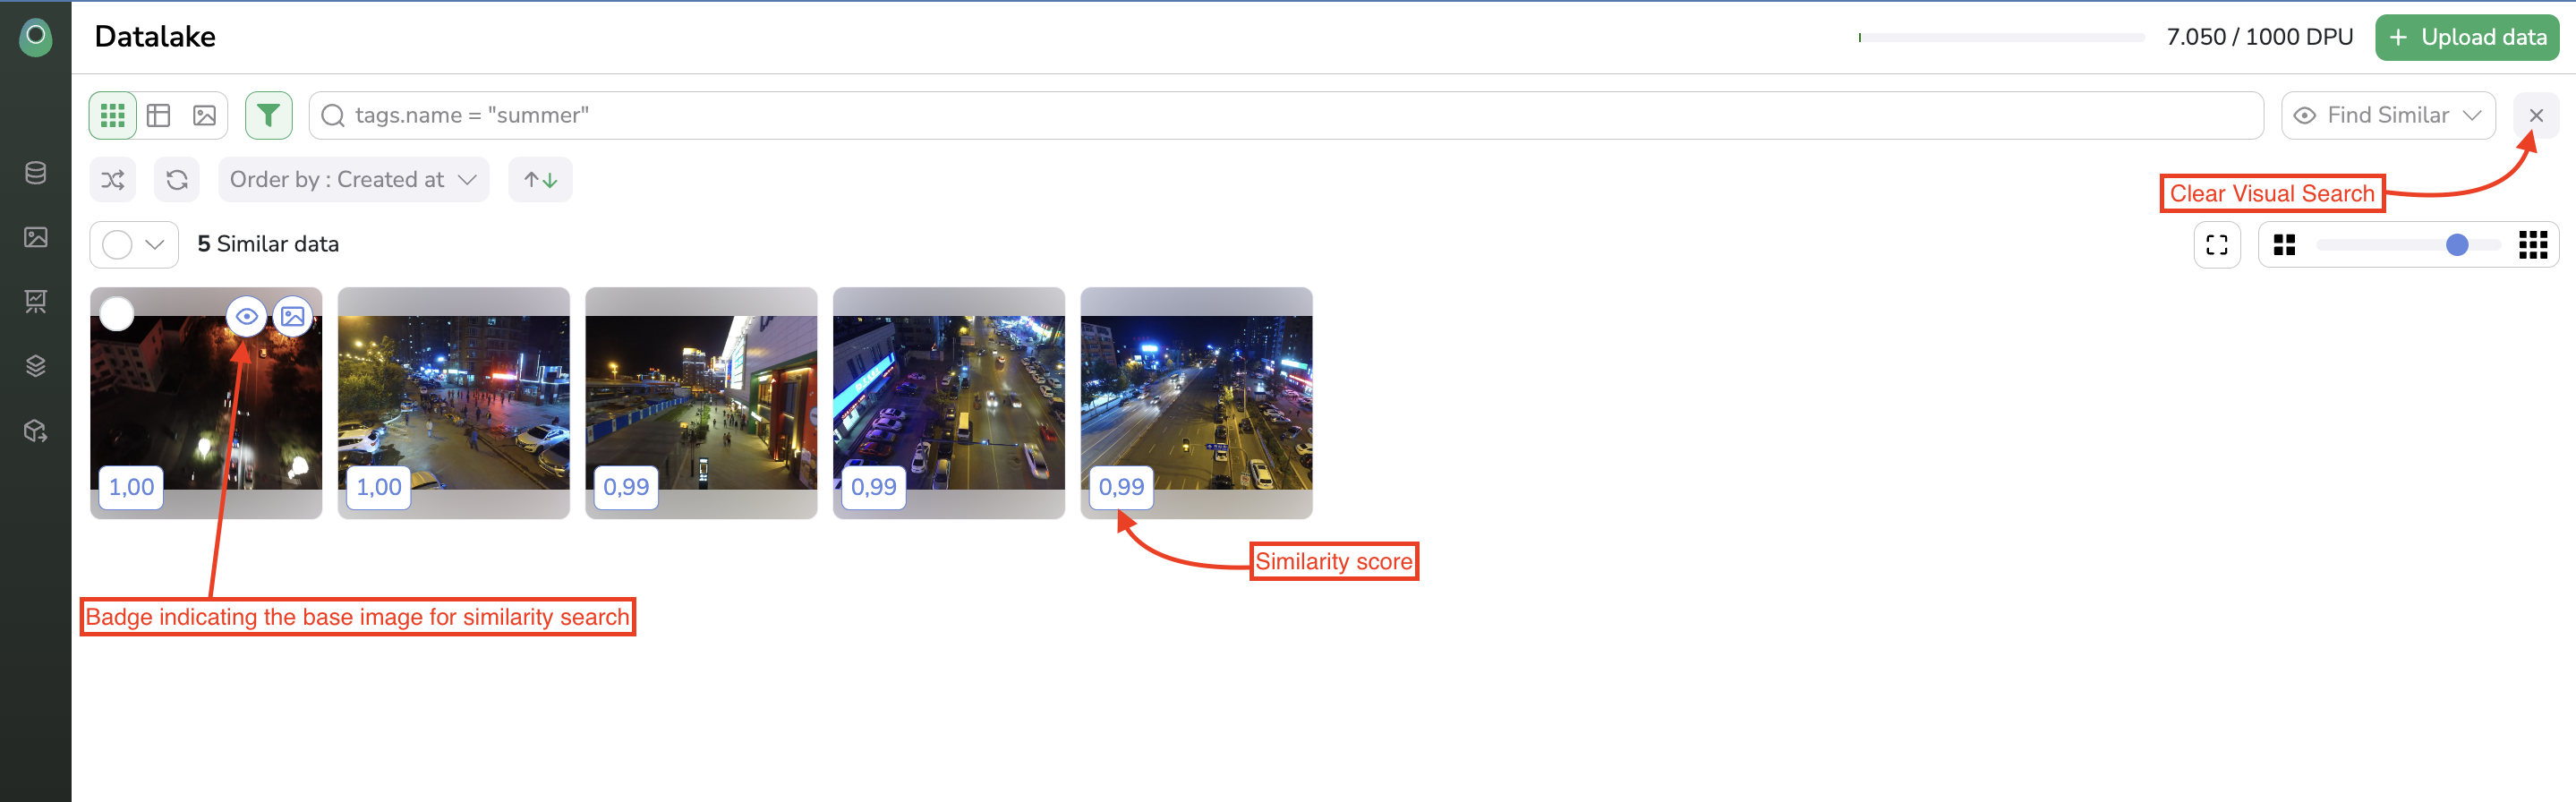
Similar images visualization
To perform this similarity search on shapes, it works almost the same as for images. You just need to switch to the shapes view, select the shapes to search for similarities, and click on the eye icon, as shown below, to display the most similar shapes:
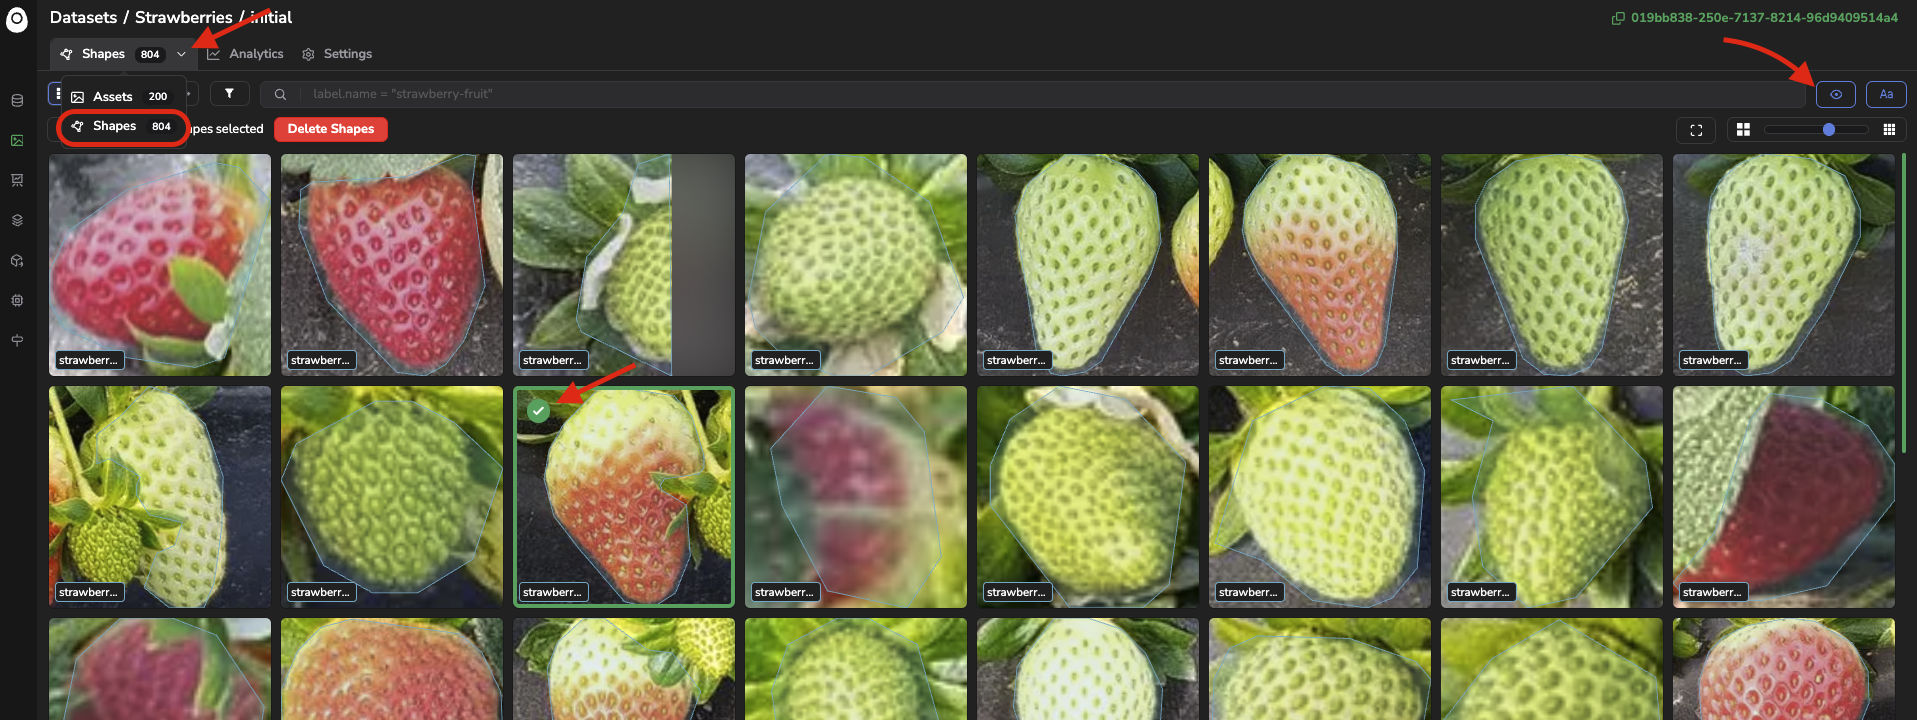
Perform a similarity search on shapes
3. Text to Image search
You can also explore your images or shapes not based on the similarity with a given image aspect, but based on a text prompt. This is made possible by the captioning embedded in the OpenClip model.
Basically, it allows identifying the images or shapes that correspond the most with a given text prompt.
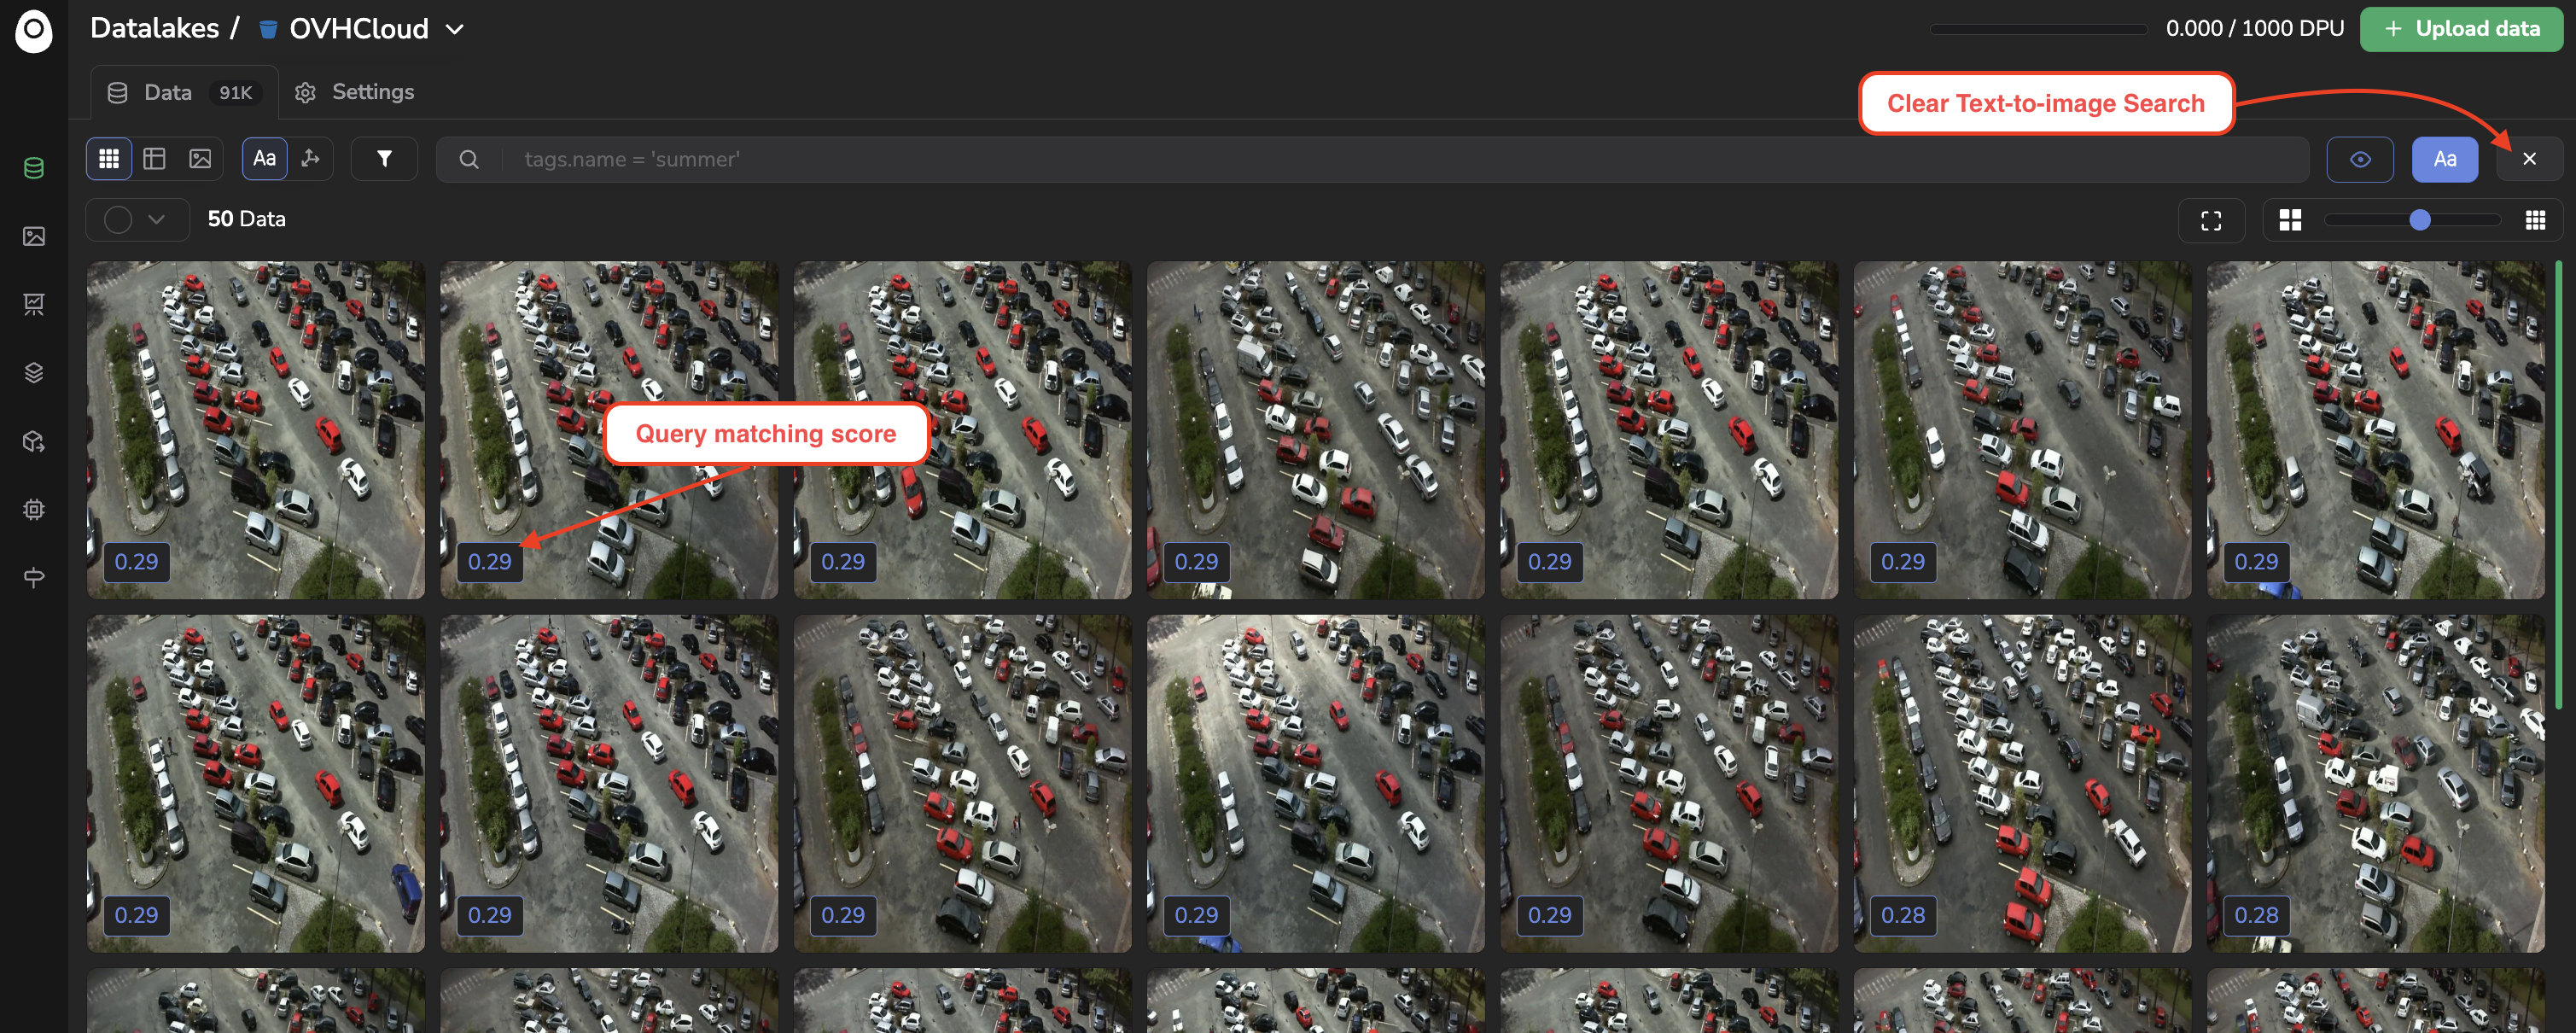
To find the X images from your DatasetVersion that fits the most a text prompt, you just need to click on the Text-To-Image icon, prompt your query, type the number of most relevant images to search for, and click on Search.
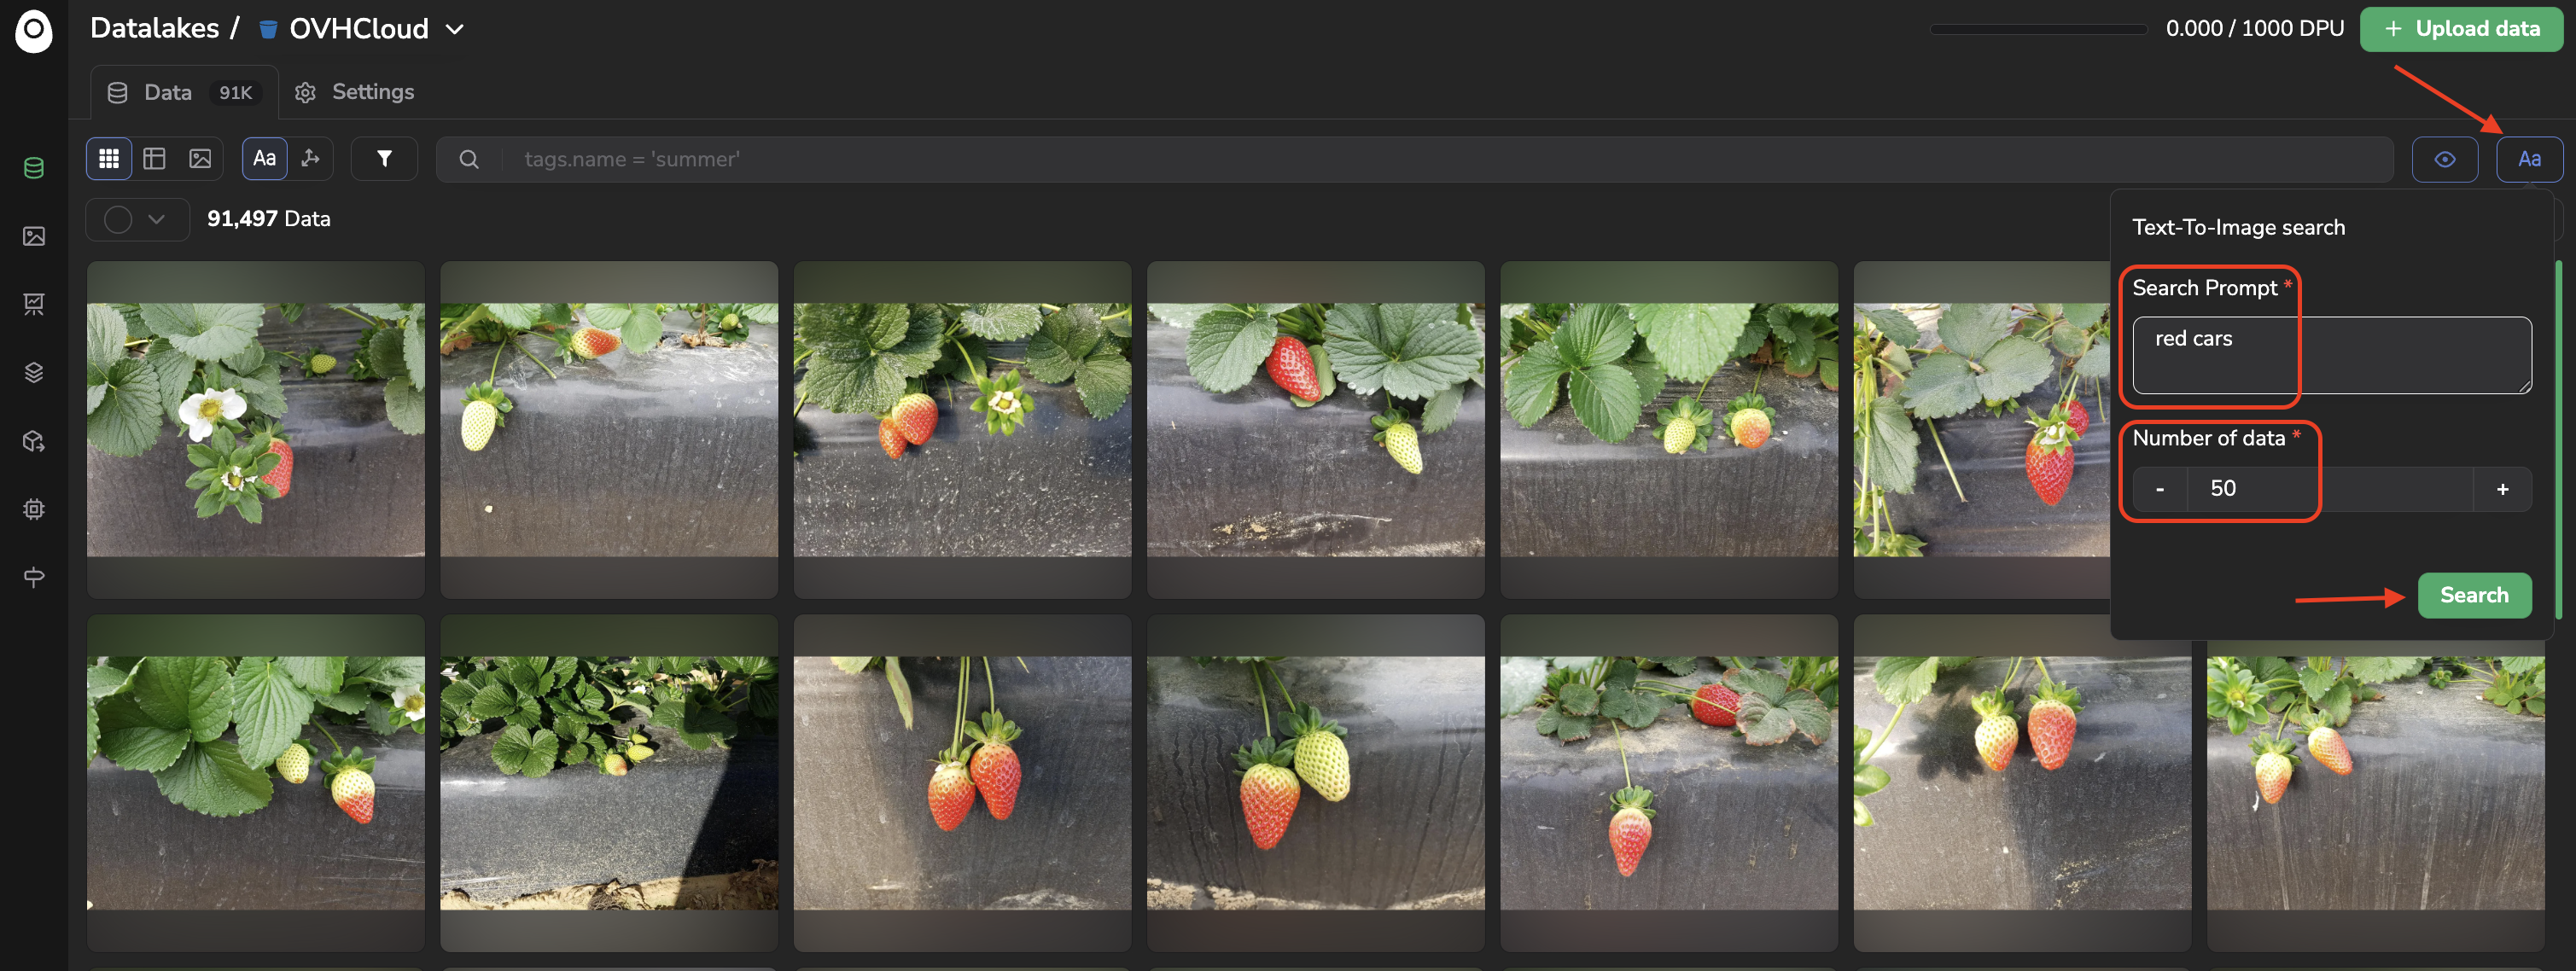
Once, more relevant images are found, they will be displayed in the DatasetVersion overview as shown below:
To perform this Text-To-Image search on shapes, it works almost the same as for images. You just need to switch to the shapes view, click on the Text-To-Image icon, and prompt your query, to display the shapes that correspond the most to this query:
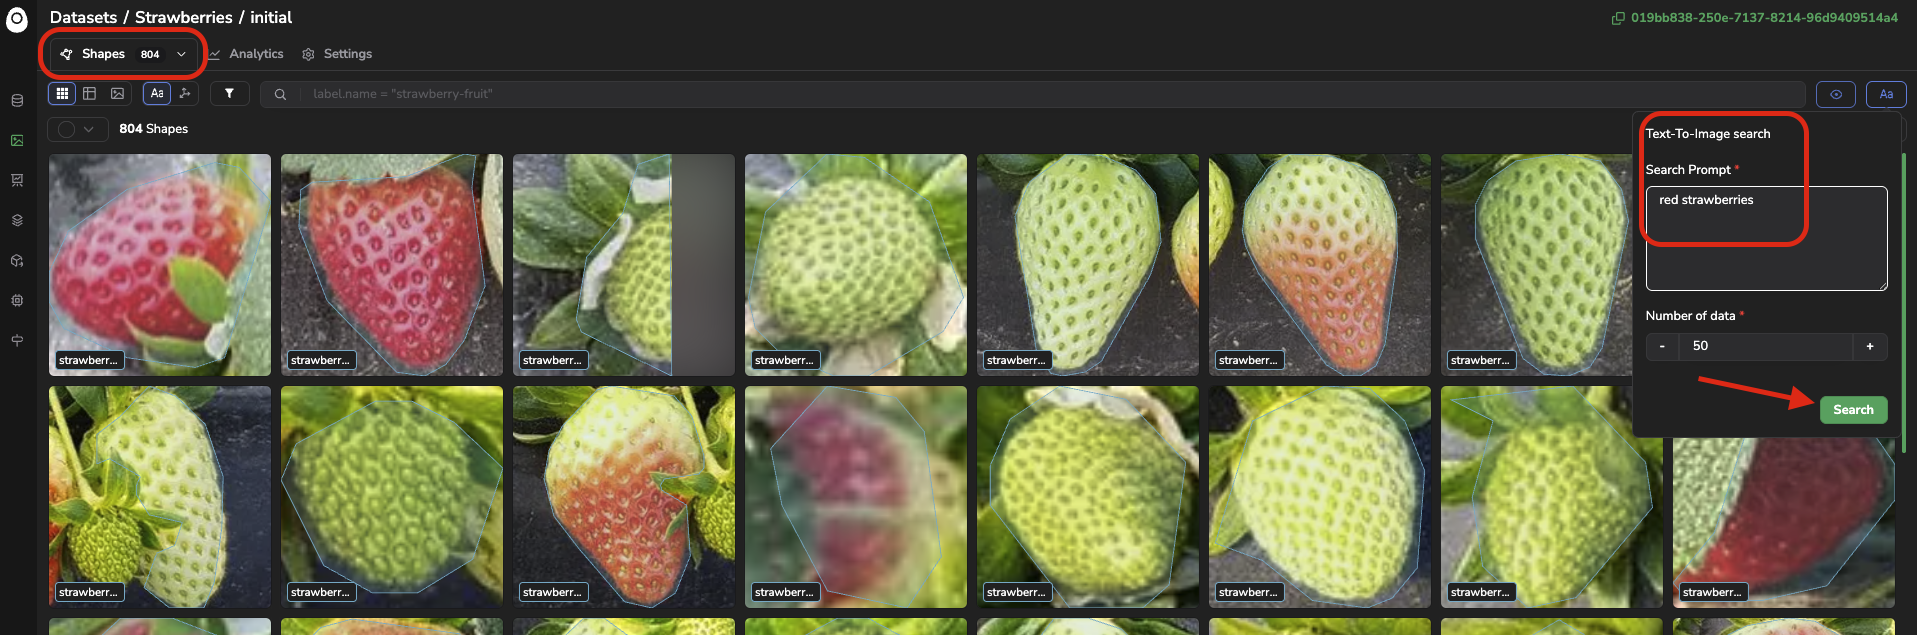
Perform a Text-to-Images search on Shapes
4. UMAP Projections
The last way to leverage embeddings in your Picsellia DatasetVersion might be the most powerfull and flexible, this one is the UMAP projection and visualisation of every embedding vector computed for the current DatasetVersion.
Basically by cliking on the UMAP Projection button, you'll access a scatter plot displaying the point cloud of all your embeddings vector computed and projected follwing the UMAP method.
If you are in the Assets view, the image embeddings projections will be displayed, whereas accessing the point cloud from the Shapes view will display all the embedding projections for the shapes.
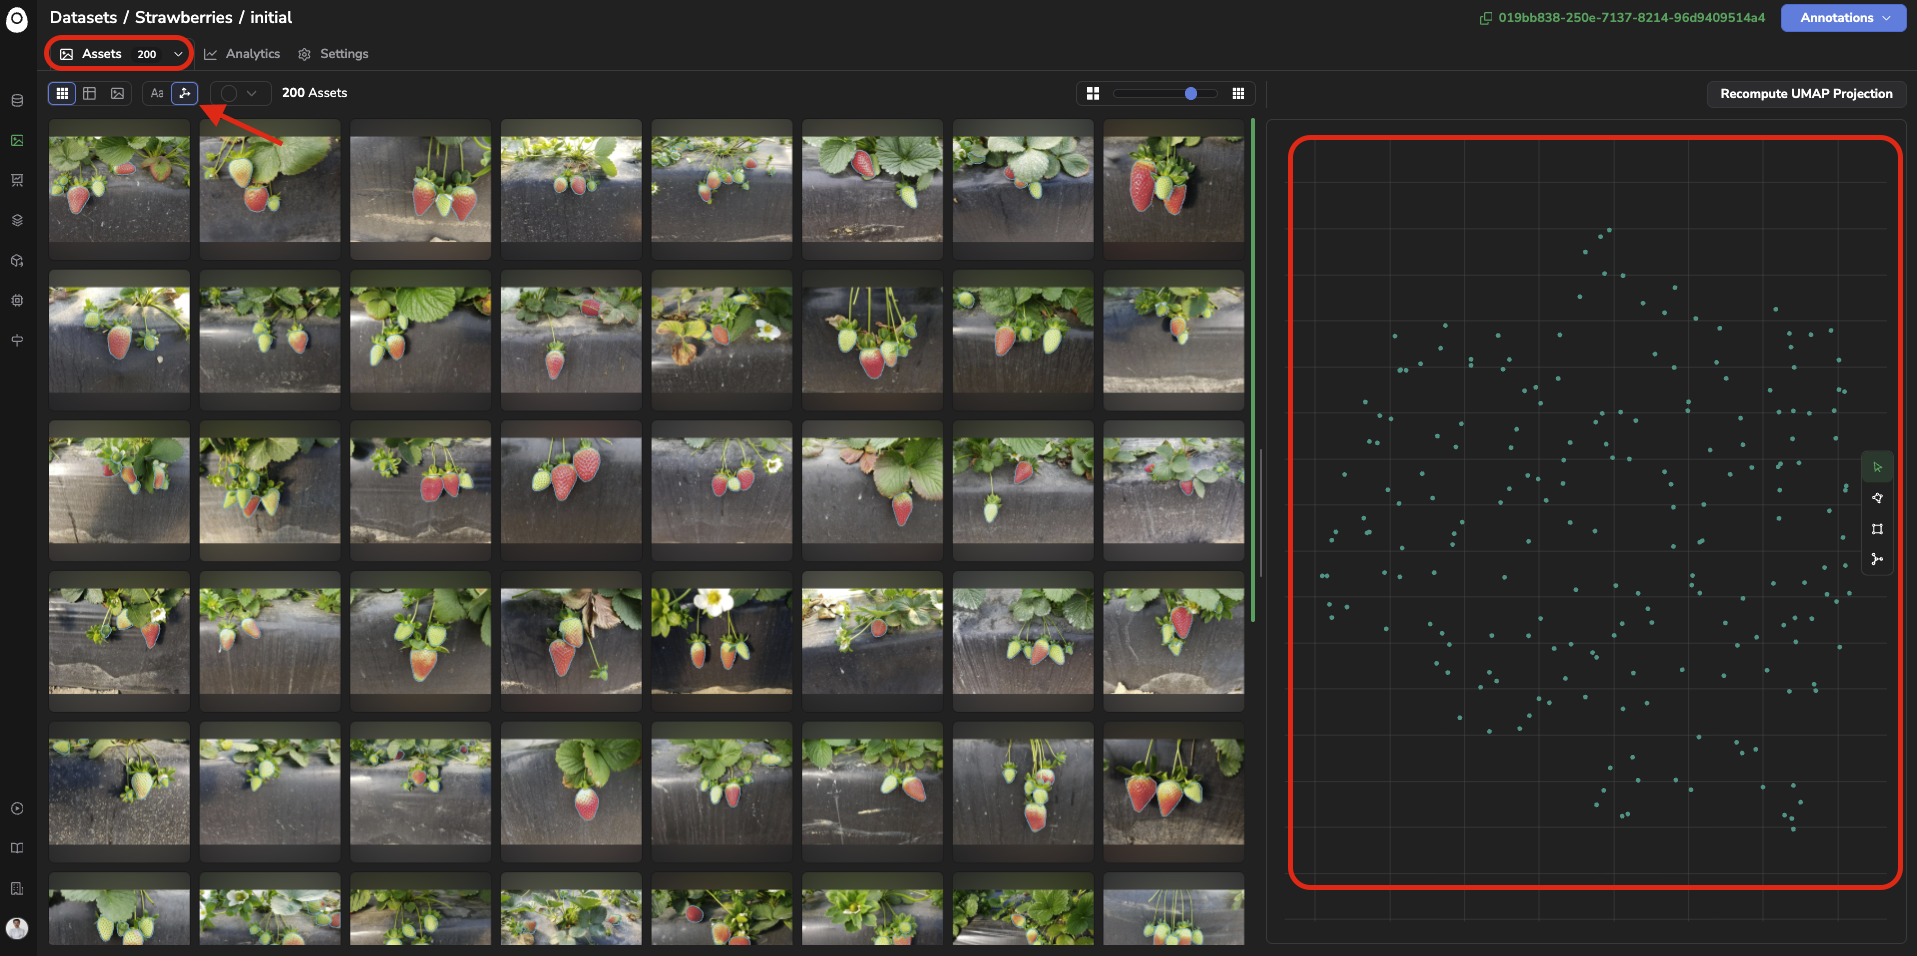
Image embeddings projections view
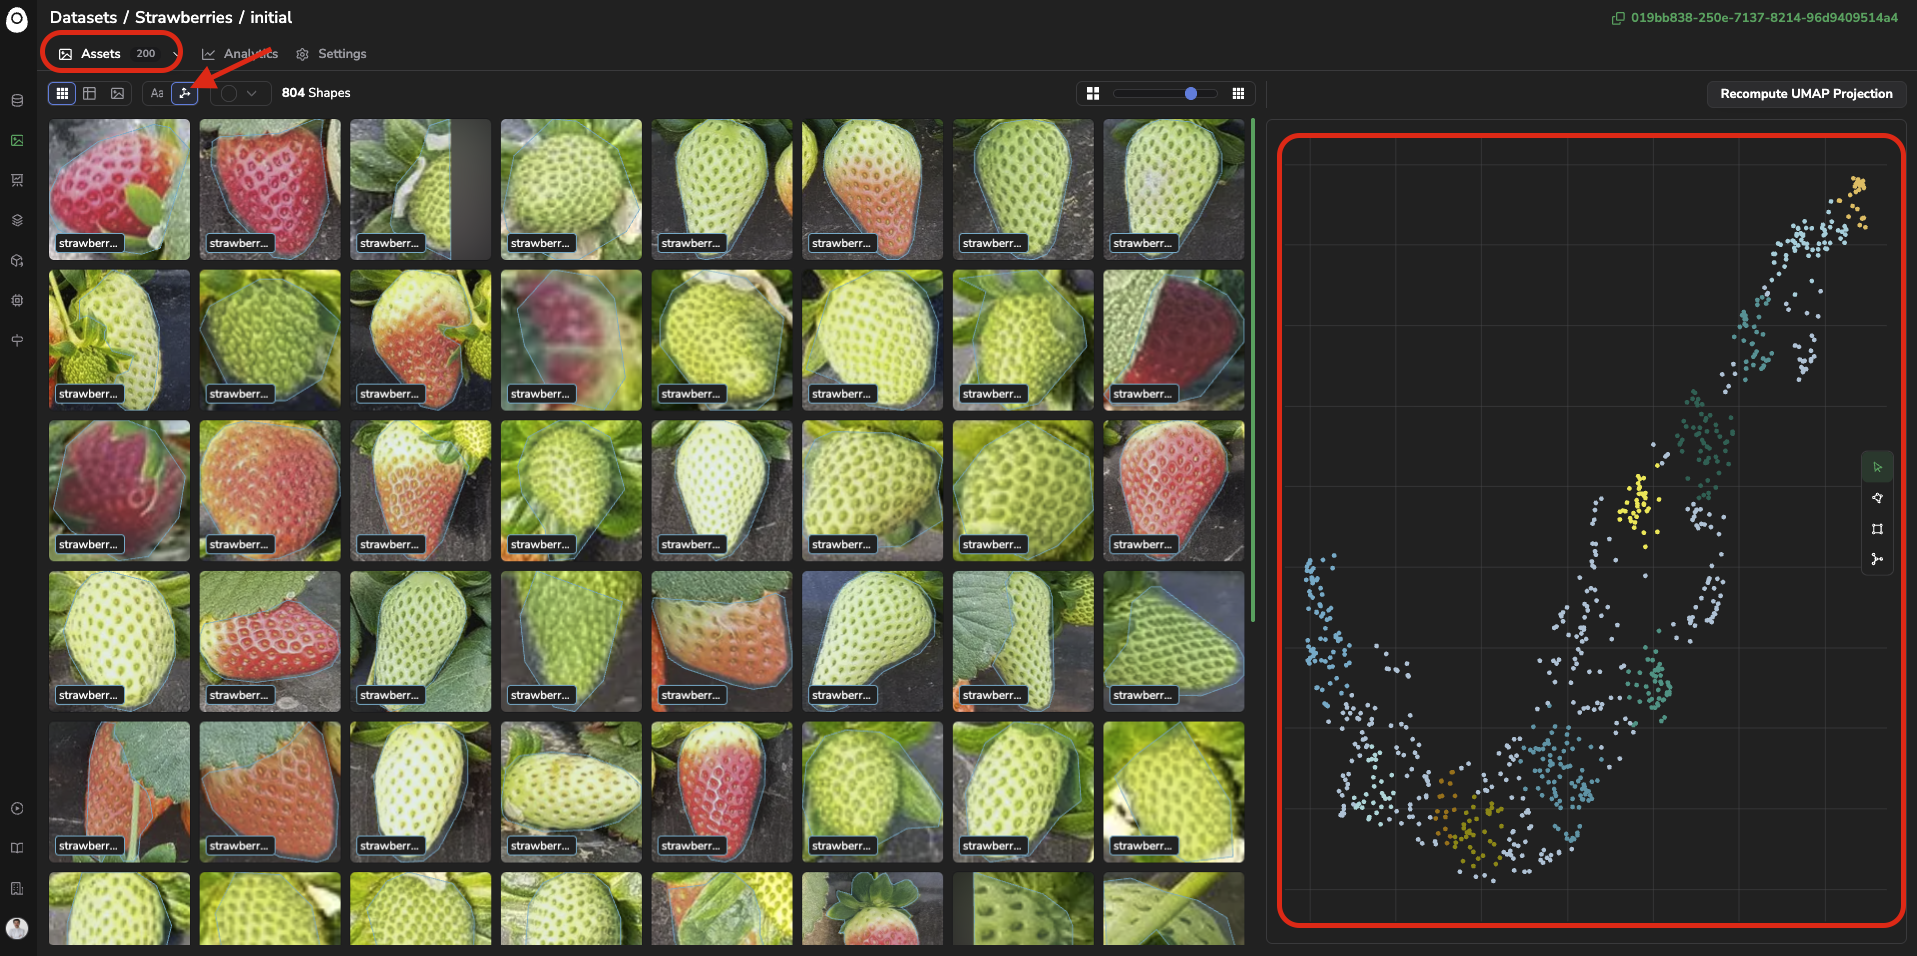
Shapes embeddings projection view
For both cases (images or shapes), each point here represents one or several images or shapes (depending on the number of image/shapes considered).
The images or shapes that are visually closed with each other are grouped using the DB SCAN clustering method and identified with the same color.
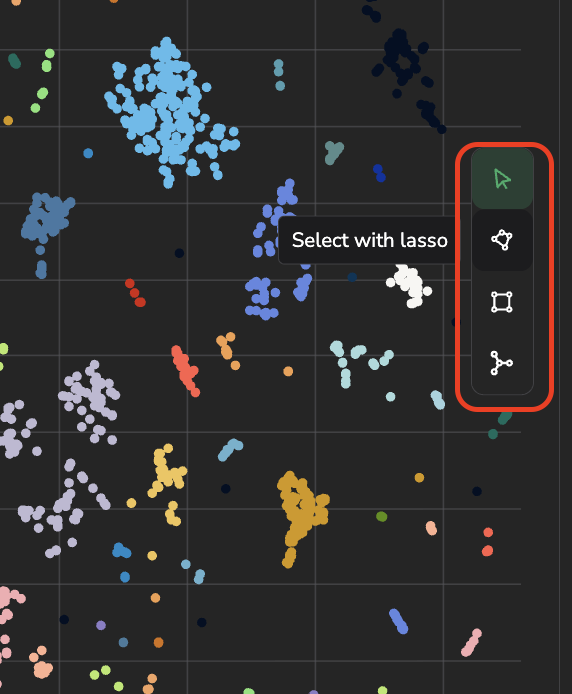
You can explore the embedding point cloud by selecting a group of points using the polygon, rectangle or cluster tools, they will allow you selecting a bunch of points:
The images or shapes corresponding to the selected points will be highlighted in red and displayed on the left panel:
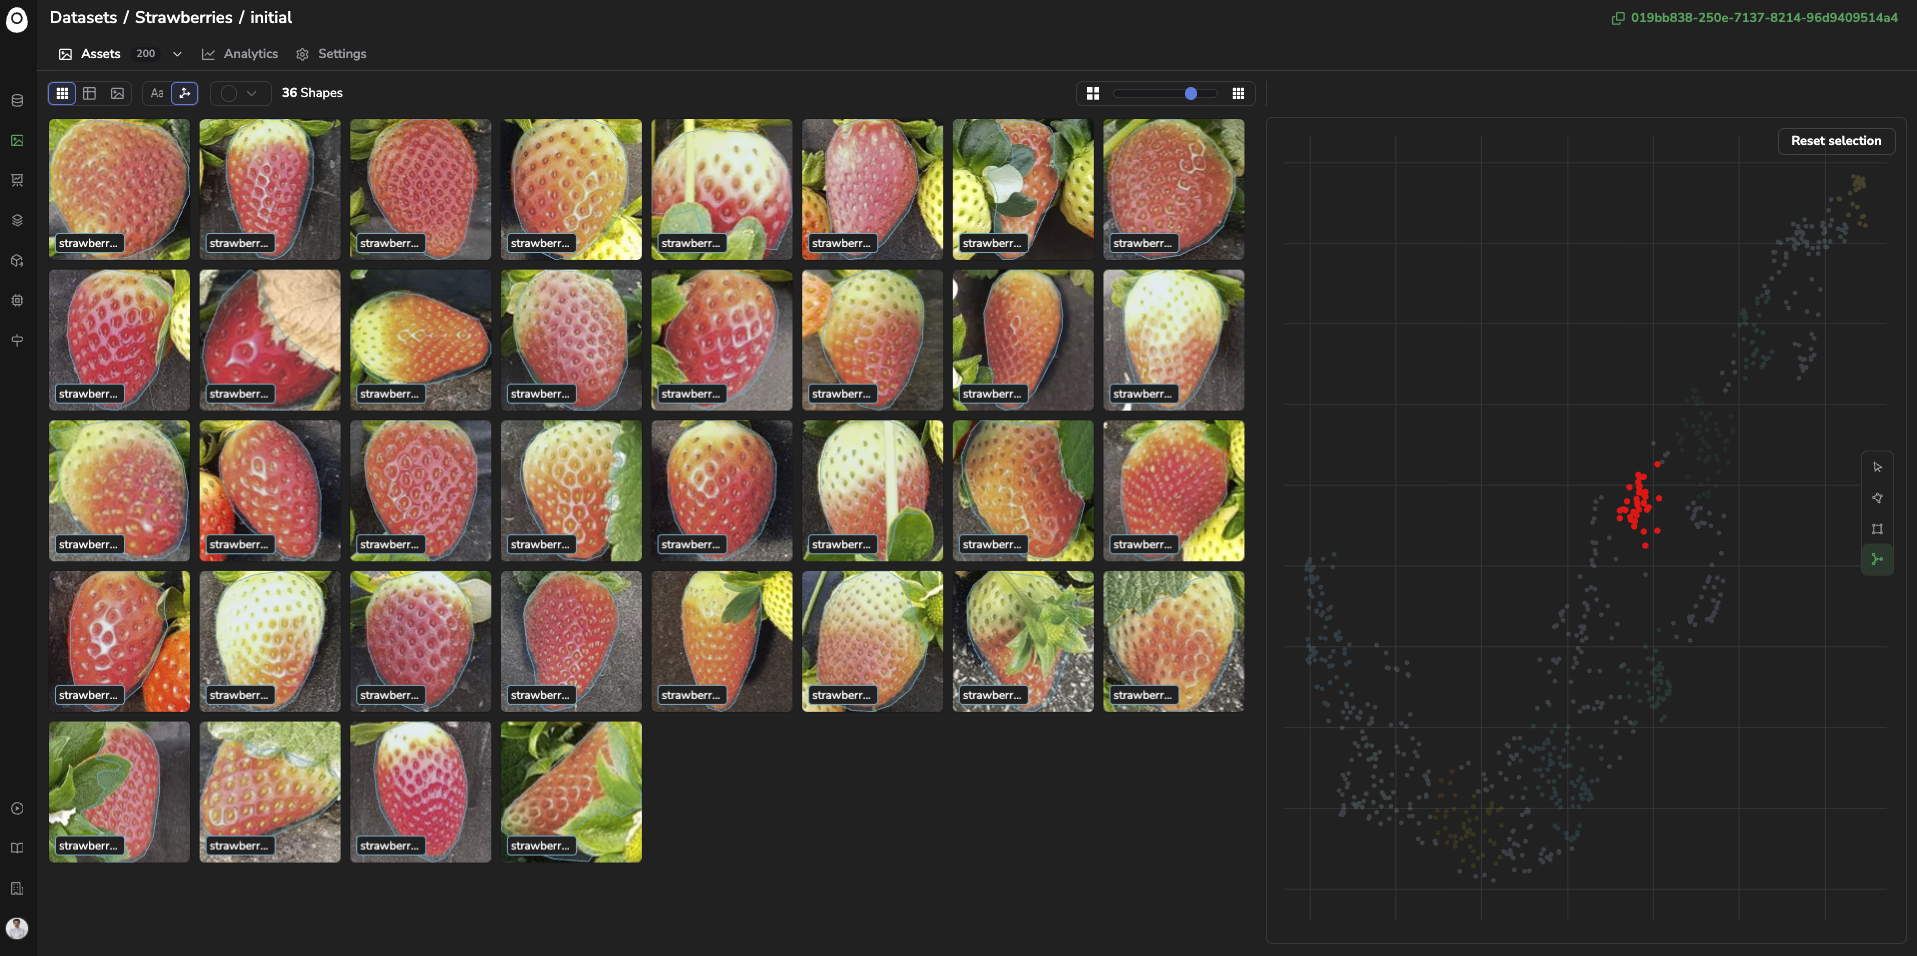
Selection of a shape cluster
Please note that for now it is not possible to explore DatasetVersion using at the same time the embeddings scatter plot alongside the SearchBar. You can switch easily between the two exploration modes easily as long as the embedding selection or query in the search are reset:

Embeddings vs Query Language explorations
Nevertheless, once images or shapes have been filtered with the embedding exploration tools, they can be selected to get tagged, processed with a DatasetVersion Processing or used to create a new DatasetVersion by switching back to the Query Language exploration view.
A very illustrative use case for images, would be to identify the isolated points that are likely outliers or corrupted images, visualize them to validate it and tag them to retrieve them easily in the future.
For shapes embedding, a common use case would be to identify isolated points because they might annotation mistakes.
To reset the embeddings selection, you can click on "Reset Selection".
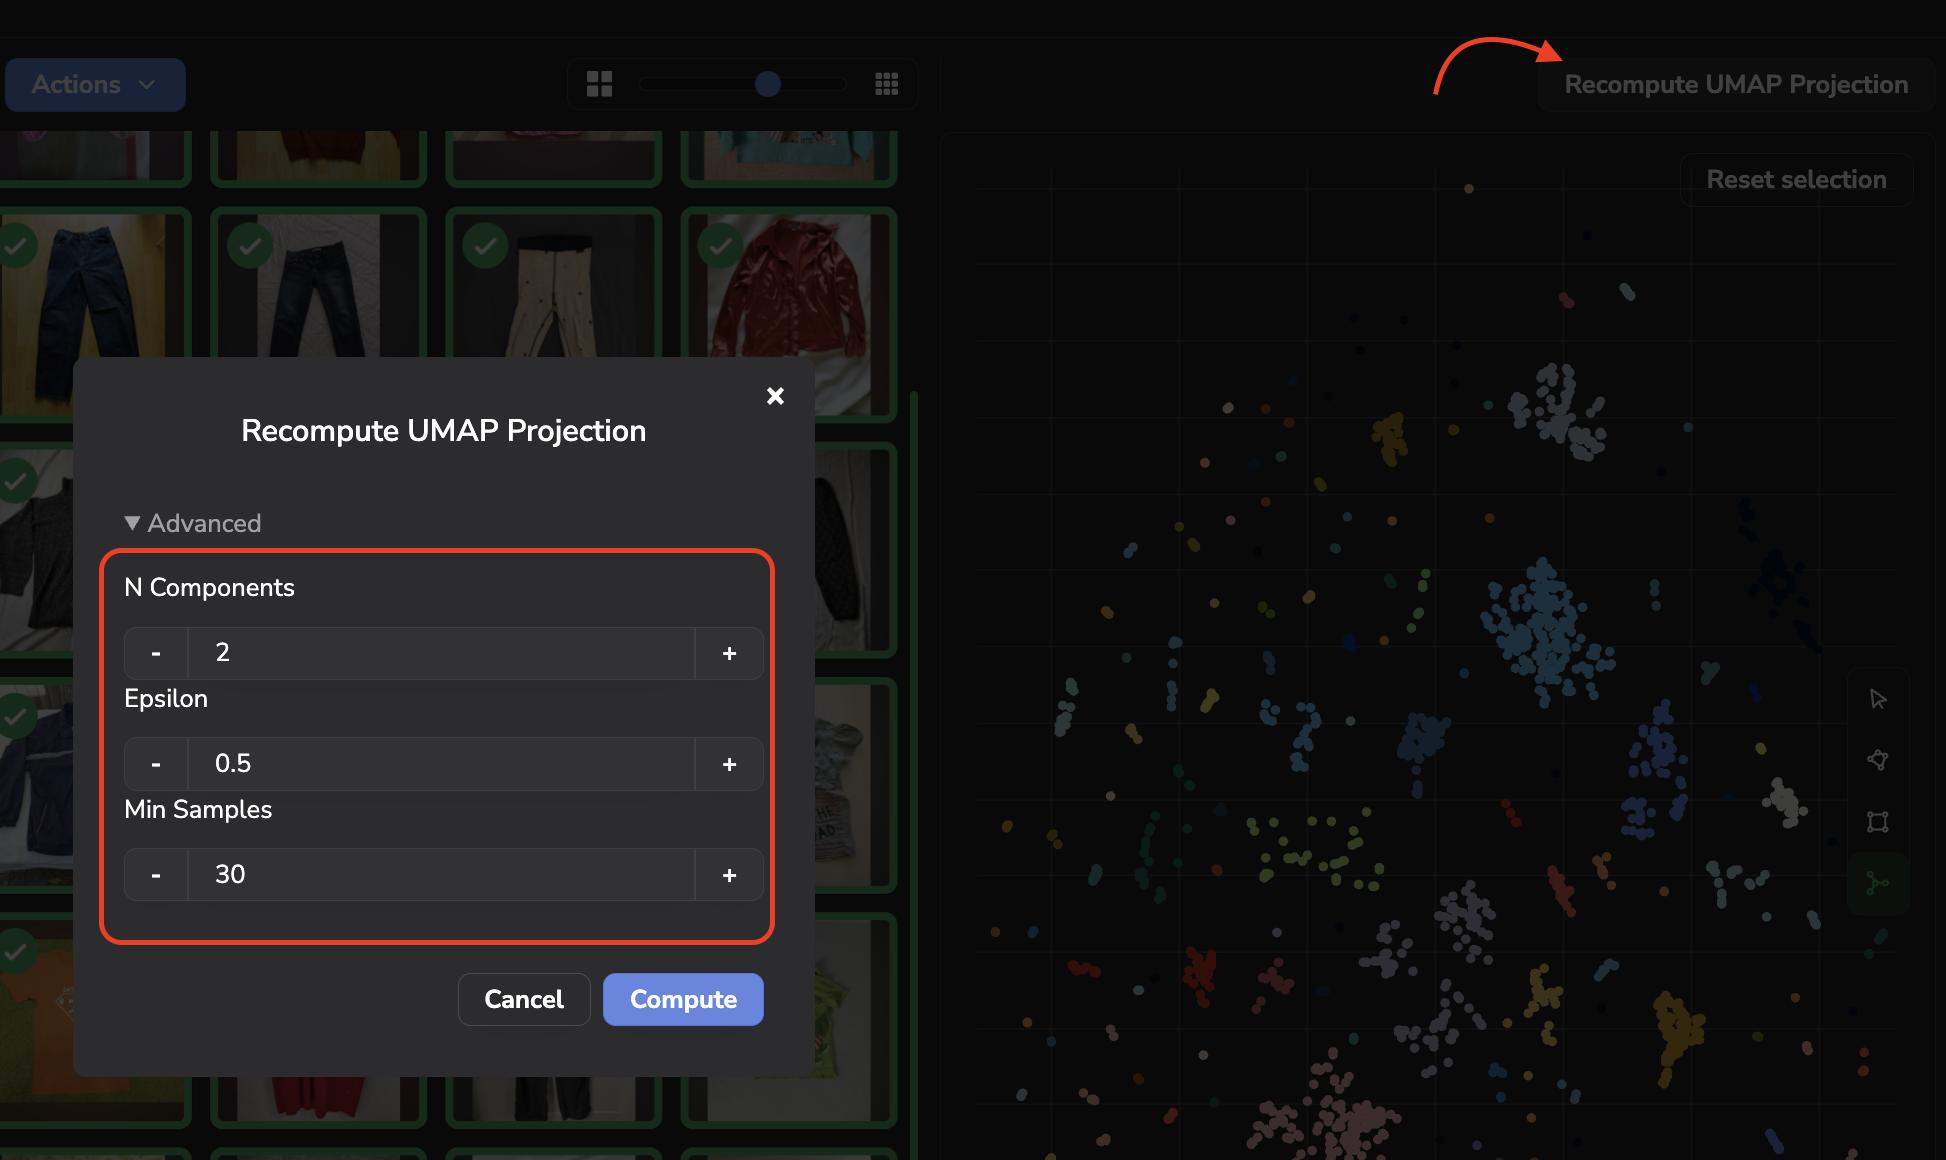
The computation of UMAP projection is not automatized so you can manually recompute the point cloud with all the latest images or shapes by clicking on Recompute UMAP Projection.
Please note that by recomputing the UMAP, you'll have the ability to set some UMAP and DBSCAN parameters as shown below:
More details about the UMAP parameters are available here.
The DBSCAN parameters are the following:
- ε (epsilon): The maximum distance between two points for them to be considered neighbors.
- Min_samples : The minimum number of points required to form a dense region.
Updated 6 months ago