

Shapes view
Alongside the Assets overview detailed here, a DatasetVersion also offers a Shapes view, focused on the individual Shape composing its Annotation rather than on the Asset as a whole.
For Computer Vision teams, switching the unit of work from Asset to Shape is what makes it possible to review Annotation quality one object at a time: spotting a mislabeled Shape, a wrong Label, or an inconsistent Attribute value is often much faster when browsing hundreds of individual Shape than when opening one Asset after another.
1. Access the Shapes view
The Shapes view is accessible from the small arrow next to the Assets tab, at the top of your DatasetVersion, which lets you switch between the Assets and Shapes view.
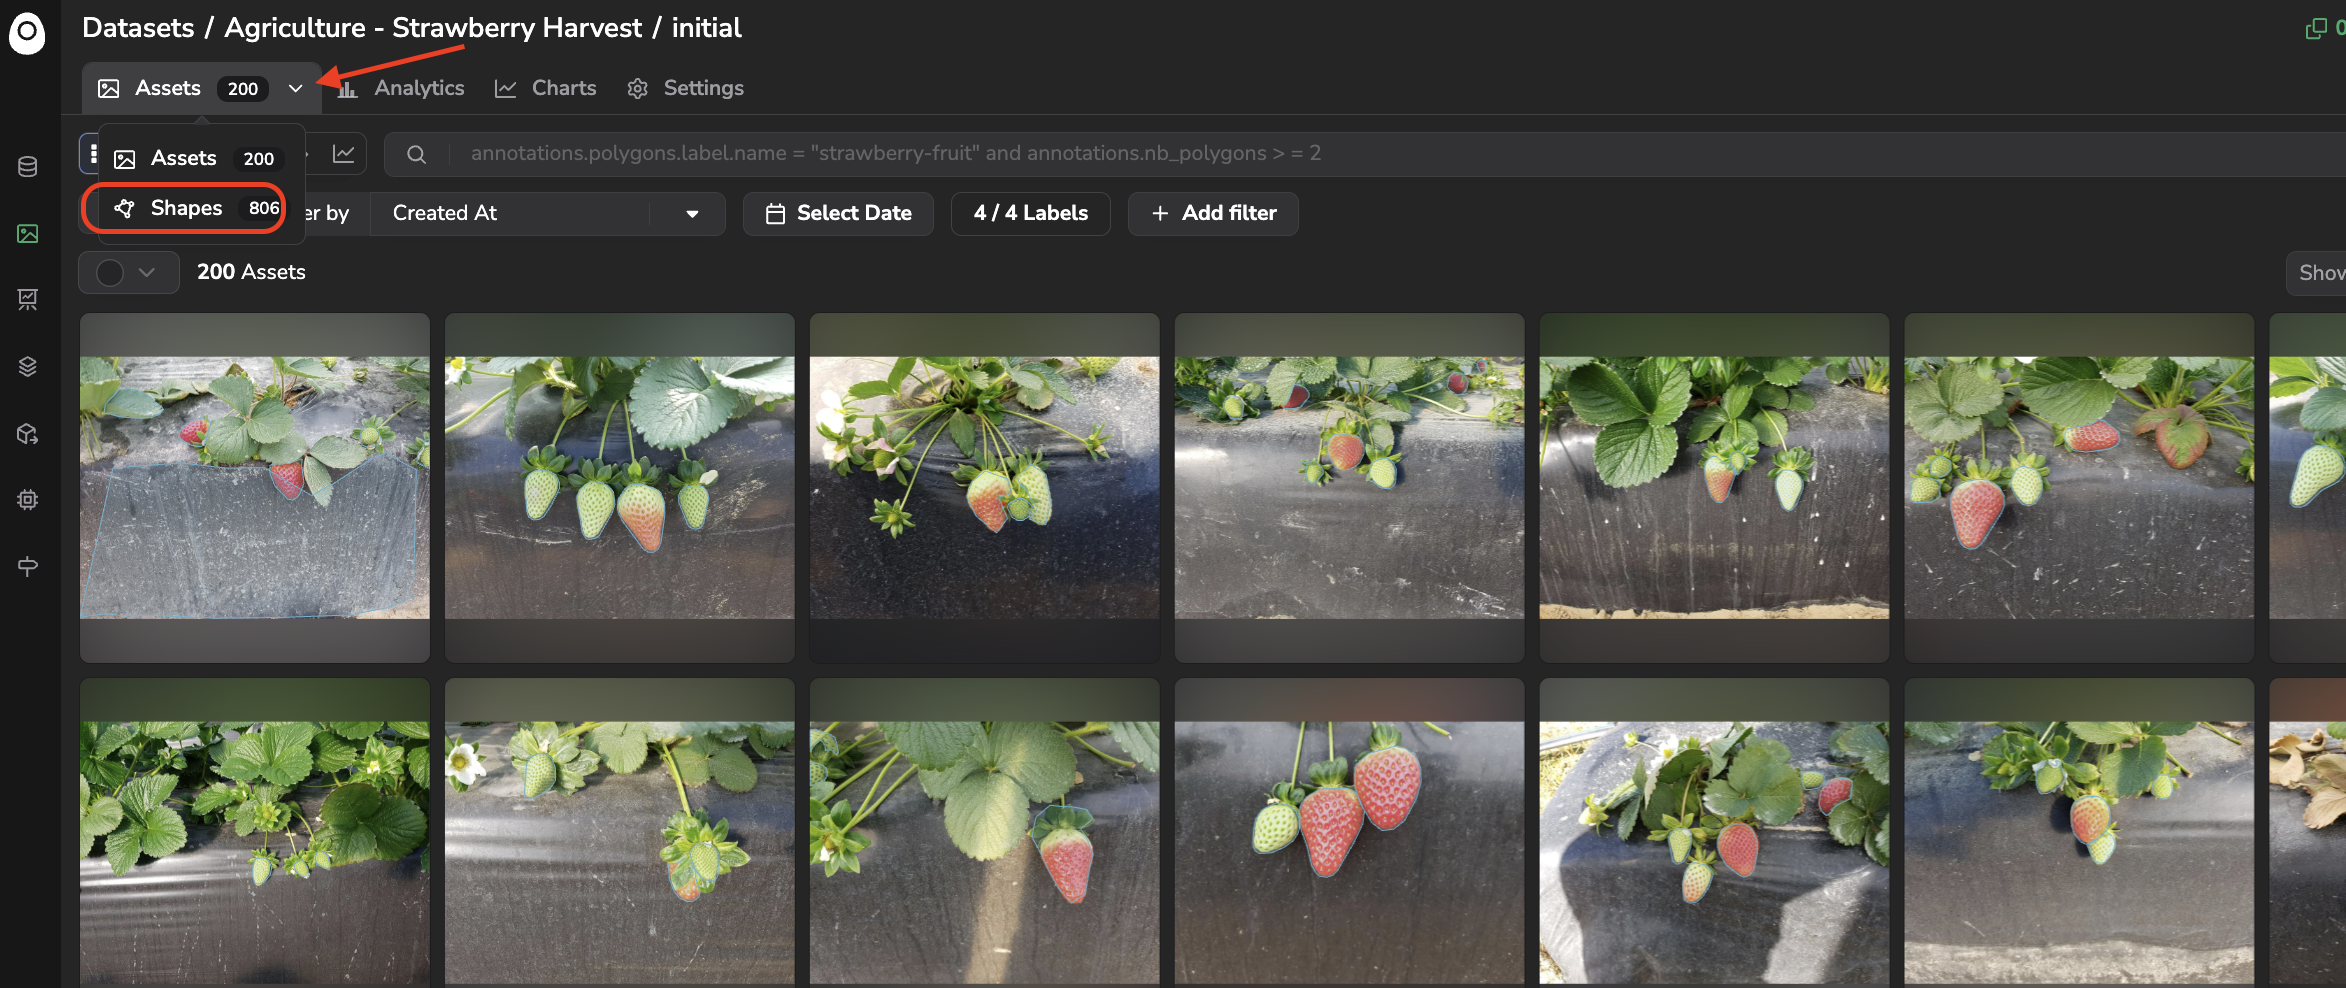
Access Shapes view
2. Understanding Shape in Picsellia
Shape in PicselliaA Shape is one element of the Annotation of an Asset: a Classification, Rectangle, Polygon, Mask, Point, Keypoints (skeletons), or Line, each carrying a Label, detailed here. The Shapes view lists every Shape of the DatasetVersion individually, instead of grouping them under their Asset.
3. Shape visualization
Shape visualizationJust like the Assets overview, the Shapes view offers three ways to visualize your Shape: Grid View, Table View, and Details View.
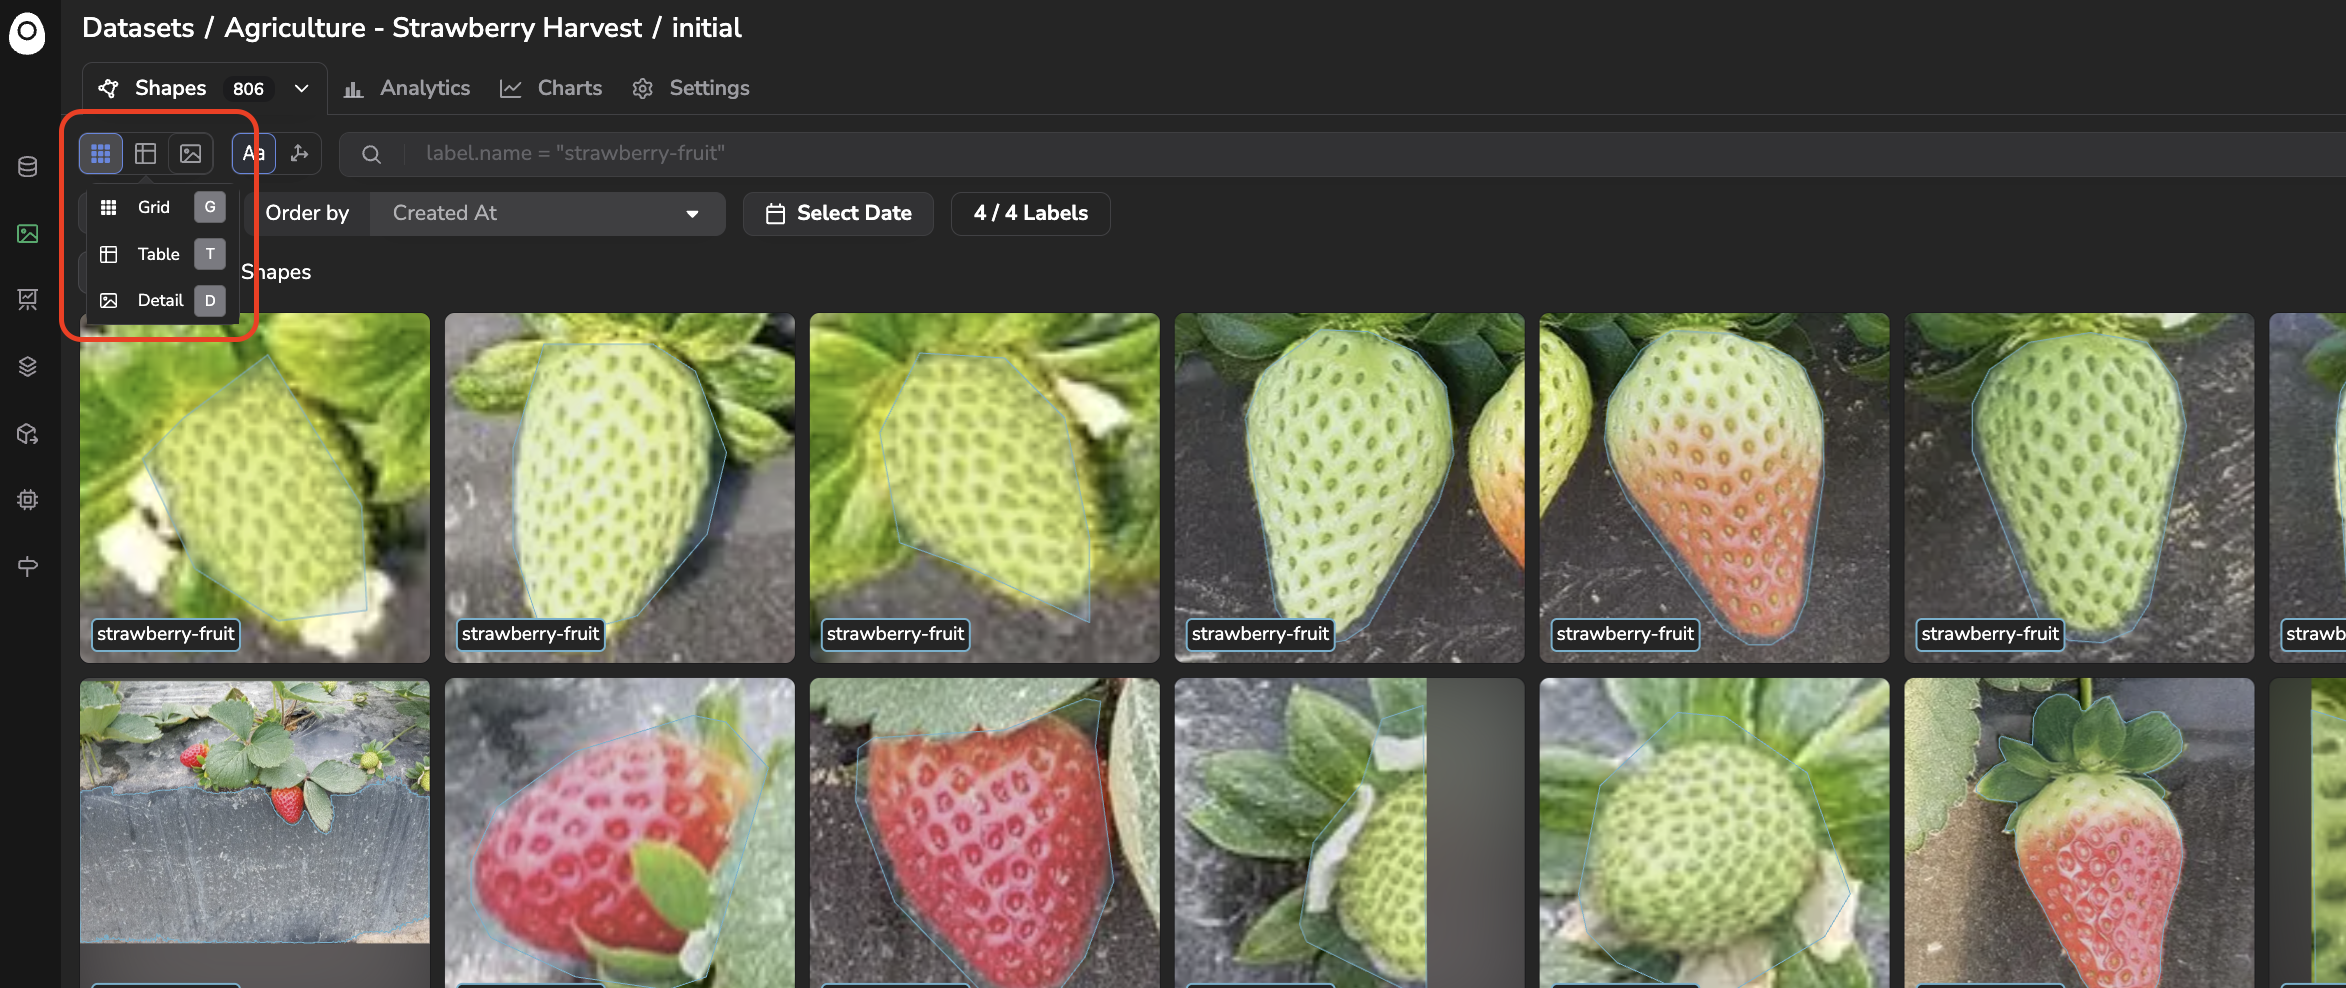
Switch views for Shapes view
A. Grid View
The Grid View displays a cropped thumbnail of each Shape, with its Label overlaid as a badge.
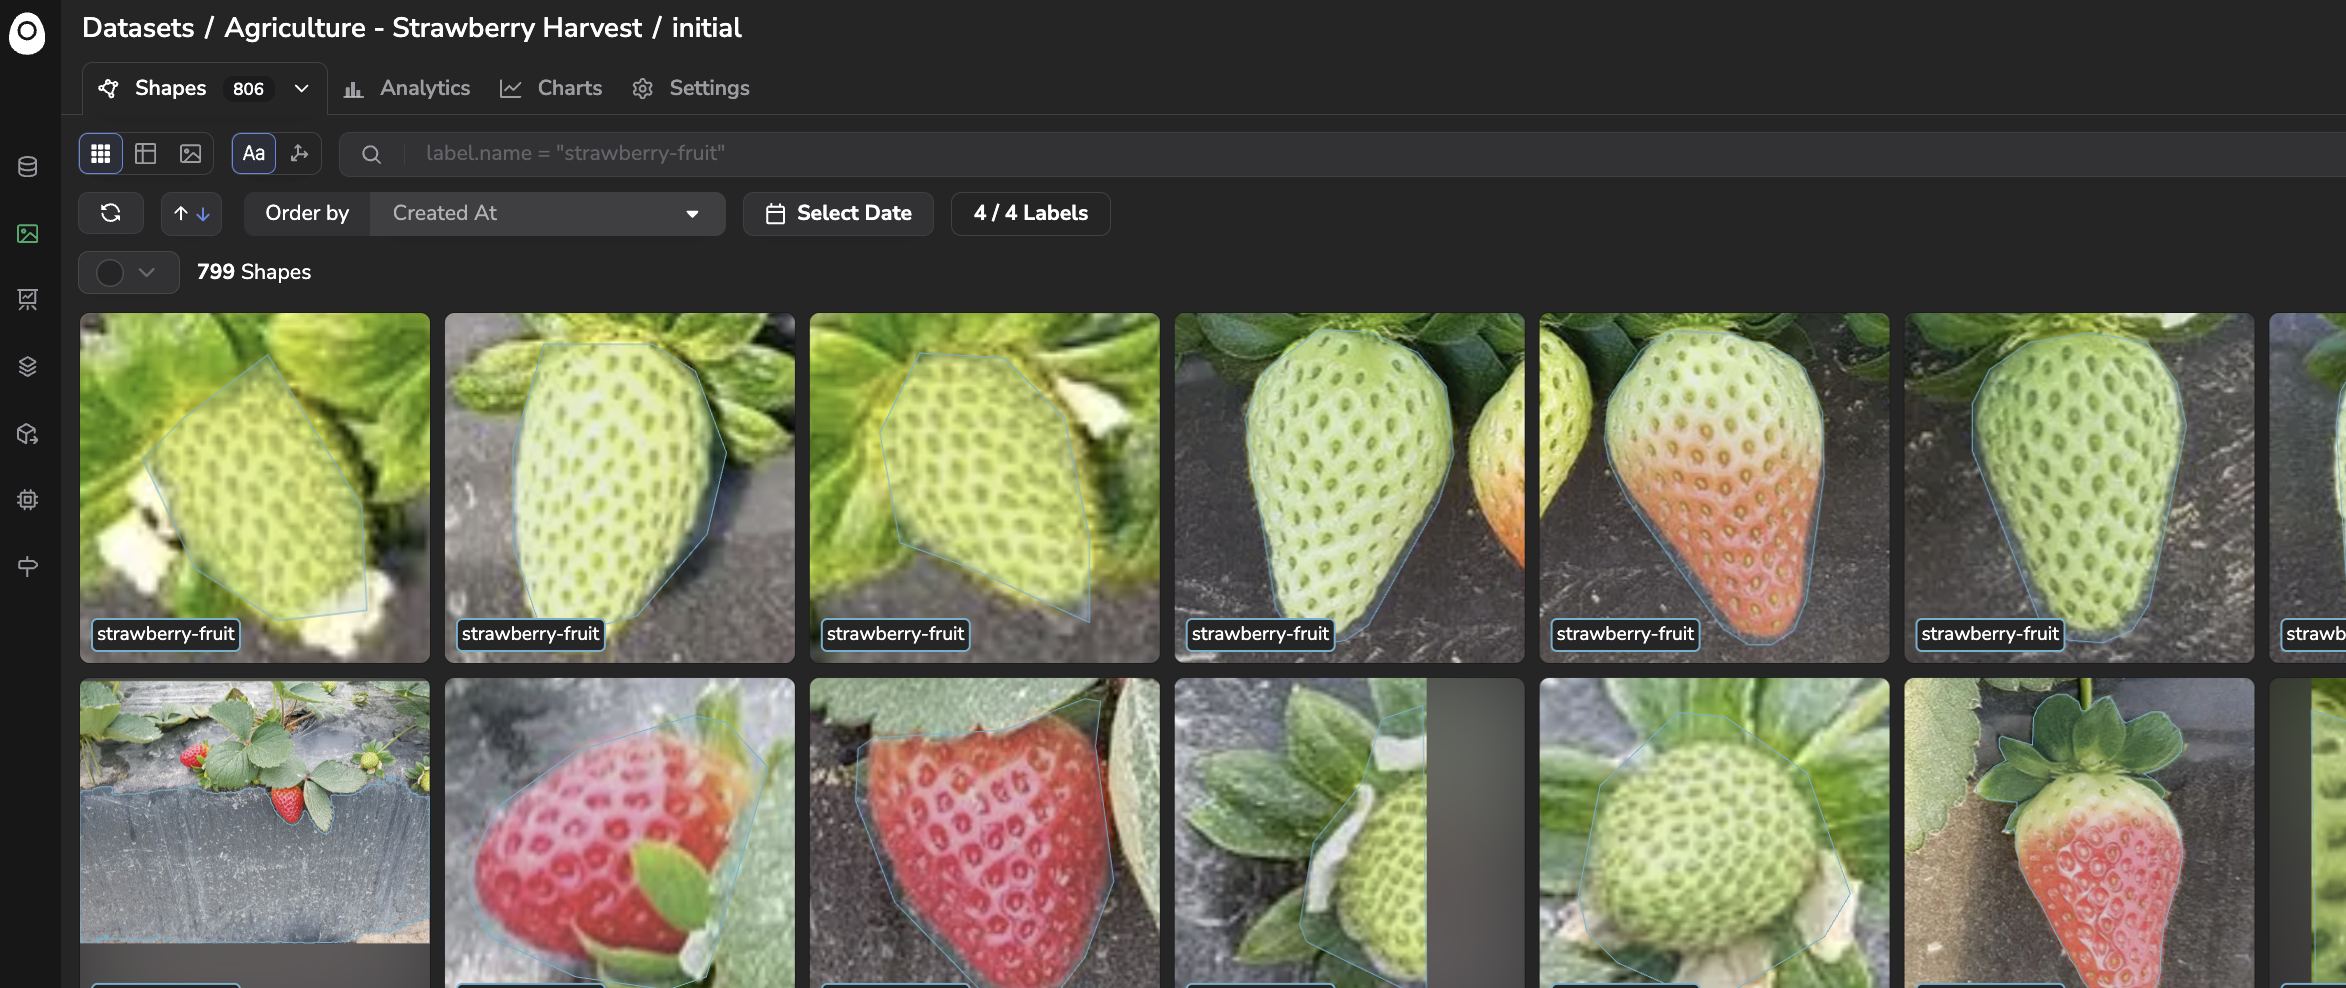
Grid view
B. Table View
The Table View focuses on the information associated with each Shape. It provides access to the following Properties:
- preview: cropped thumbnail of the
Shape - filename: filename of the
AssettheShapebelongs to - label:
Labelof theShape - data width / data height: dimensions in pixels of the underlying
Data
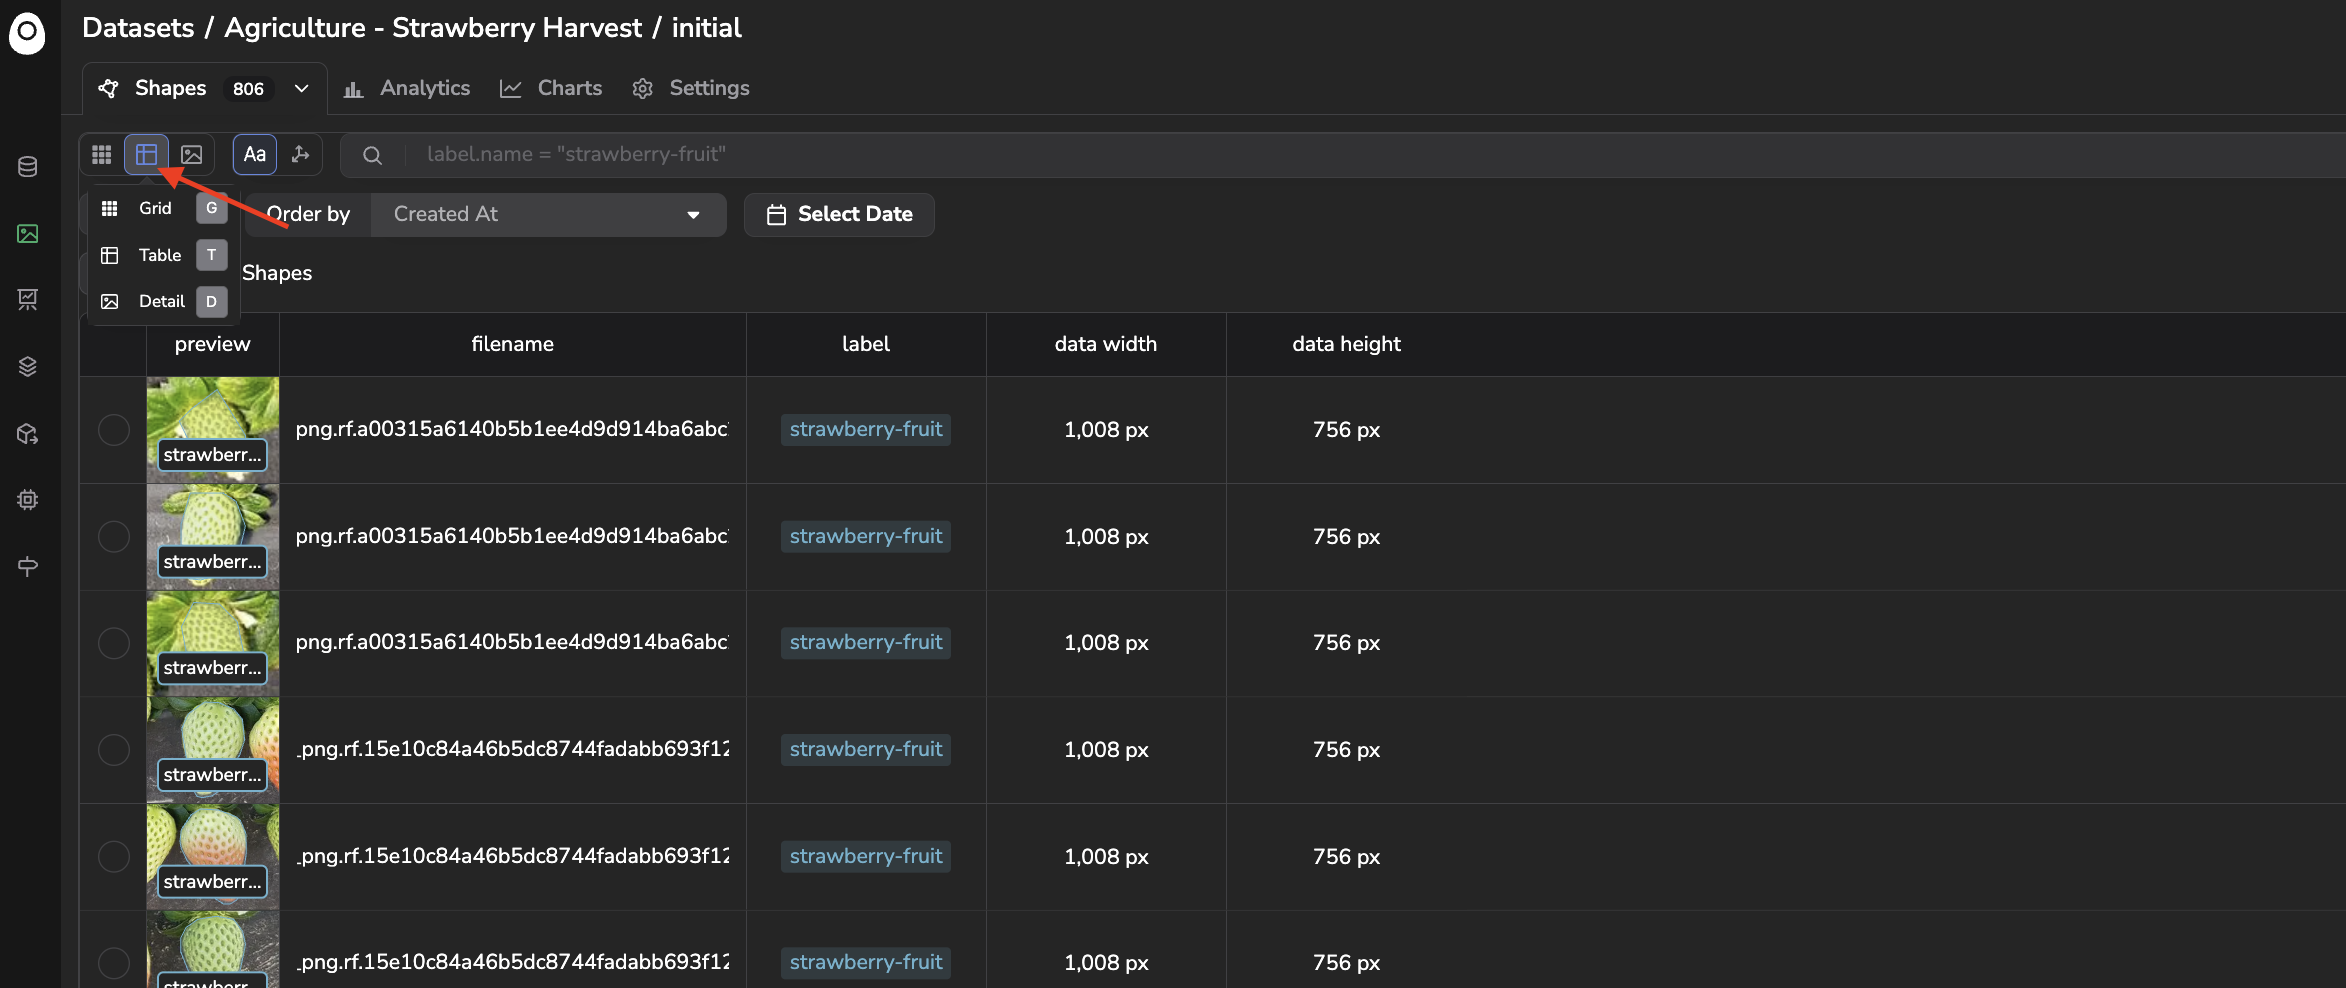
Table view
C. Details View
The Details View shows a single Shape at a time, overlaid on its Asset. The panel on the right displays its Id, Asset Id, Label, filename, object name, Data width/height/area, file size, source, and Metadata.
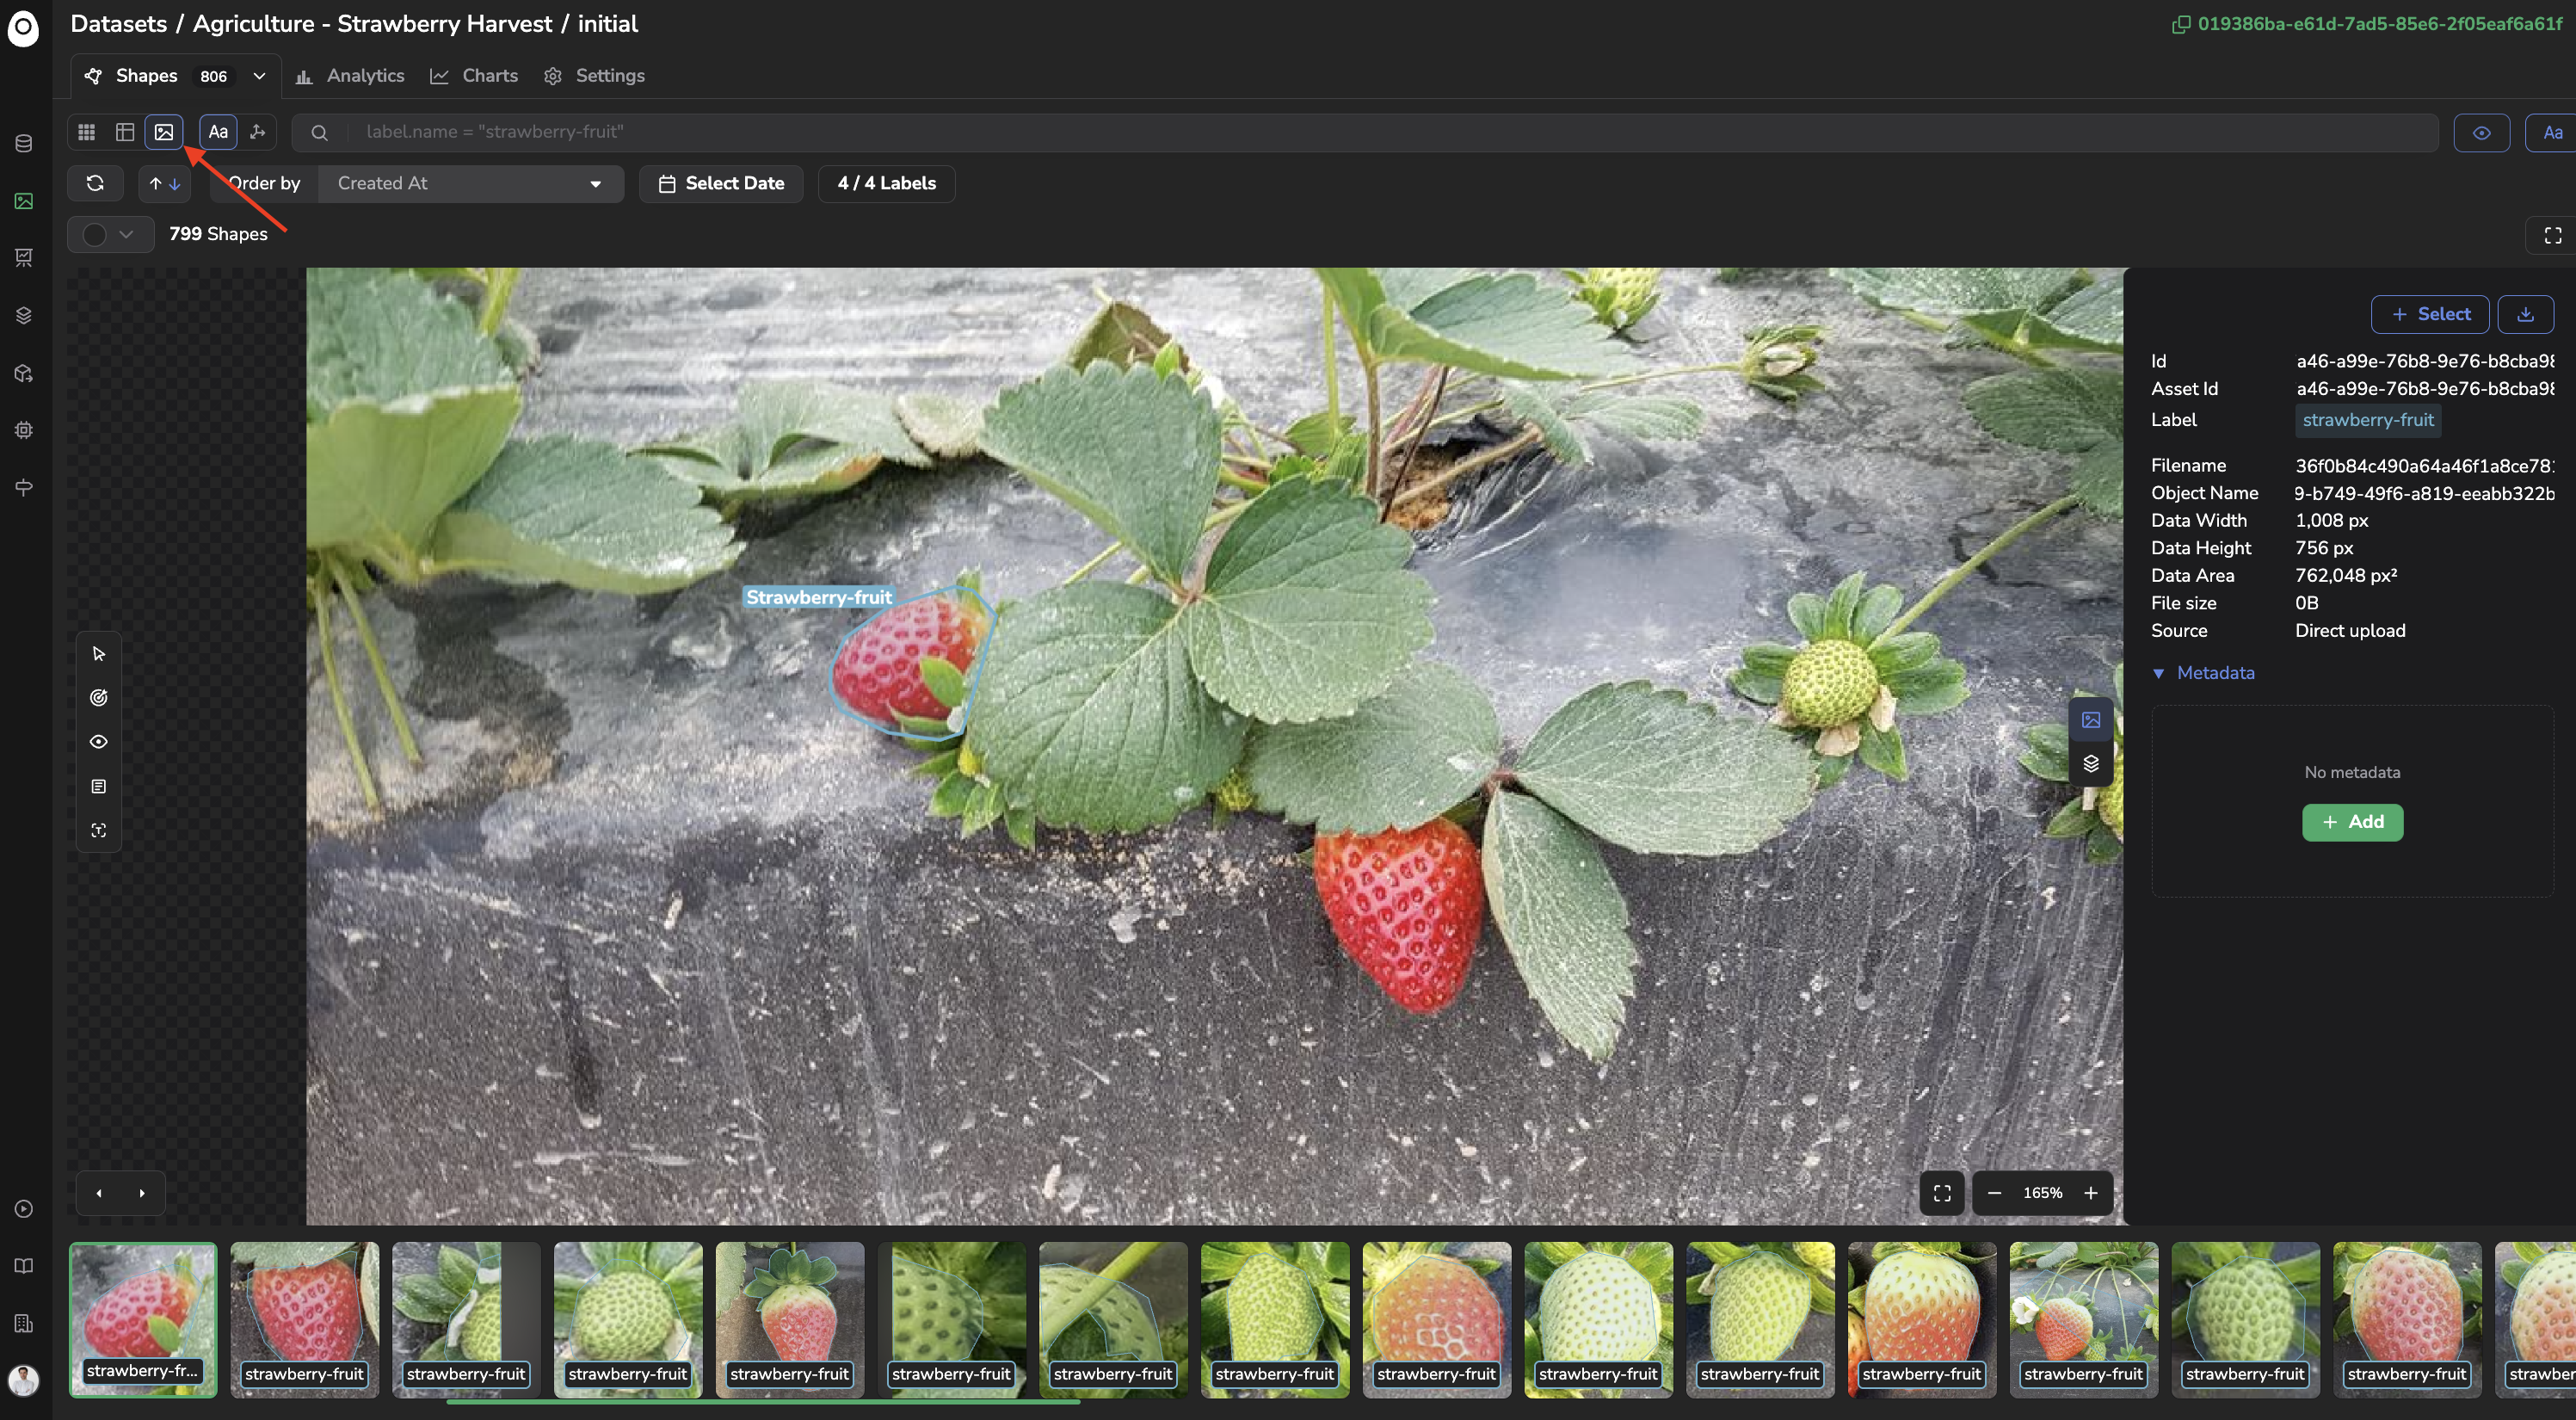
Details view
4. Exploration modes and filtering
Just like the Assets overview, the Shapes view has its own Search Bar, using the same Query Language mechanics detailed here, for instance label.name = "crack".
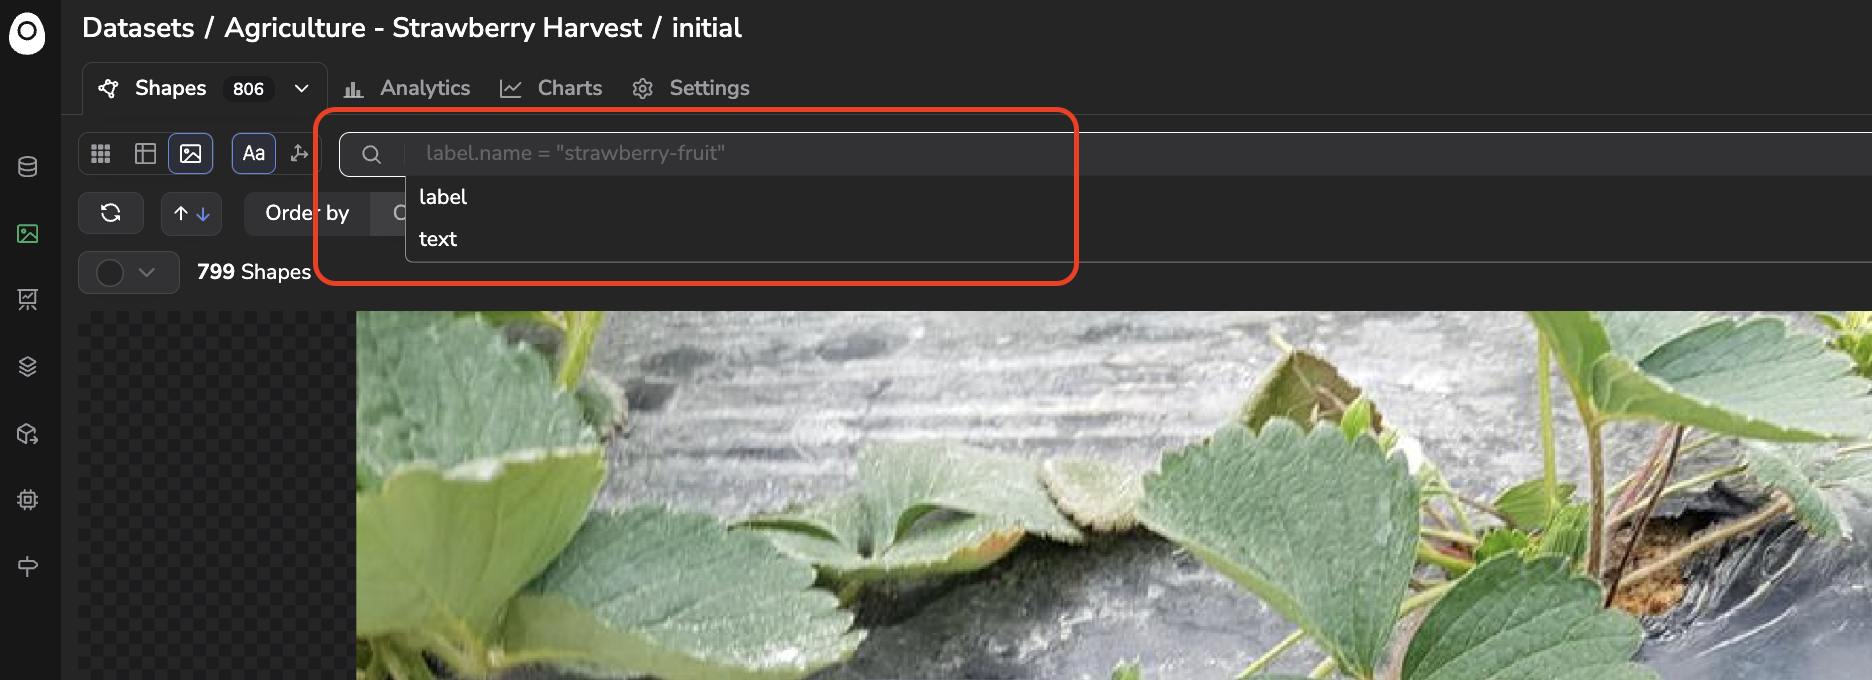
Query Language for Shapes viewThe Query Language of the Shapes view only exposes a reduced set of fields, scoped to the
Shapeand itsLabel(such aslabel.name). It does not expose the fullAsset/Dataobject schema (data.*,annotations.*,tags, ...) available from the Assets overview's Search Bar, detailed here.
Alongside the Search Bar, you can also filter Shape by date using the Select Date button. In Grid and Details view, you can also filter which Label are displayed using the x/x Labels button.
Unlike the Assets overview, the Shapes view does not have an Add filter button:
Custom Metadatafiltering is only available at theAssetlevel.
Next to the search bar, a mode selector also lets you switch to the Embeddings exploration mode, which replaces the main view with a UMAP projection of your Shape embeddings, alongside similarity search and text-to-image search. This works the same way as on the Assets overview, and is detailed here.
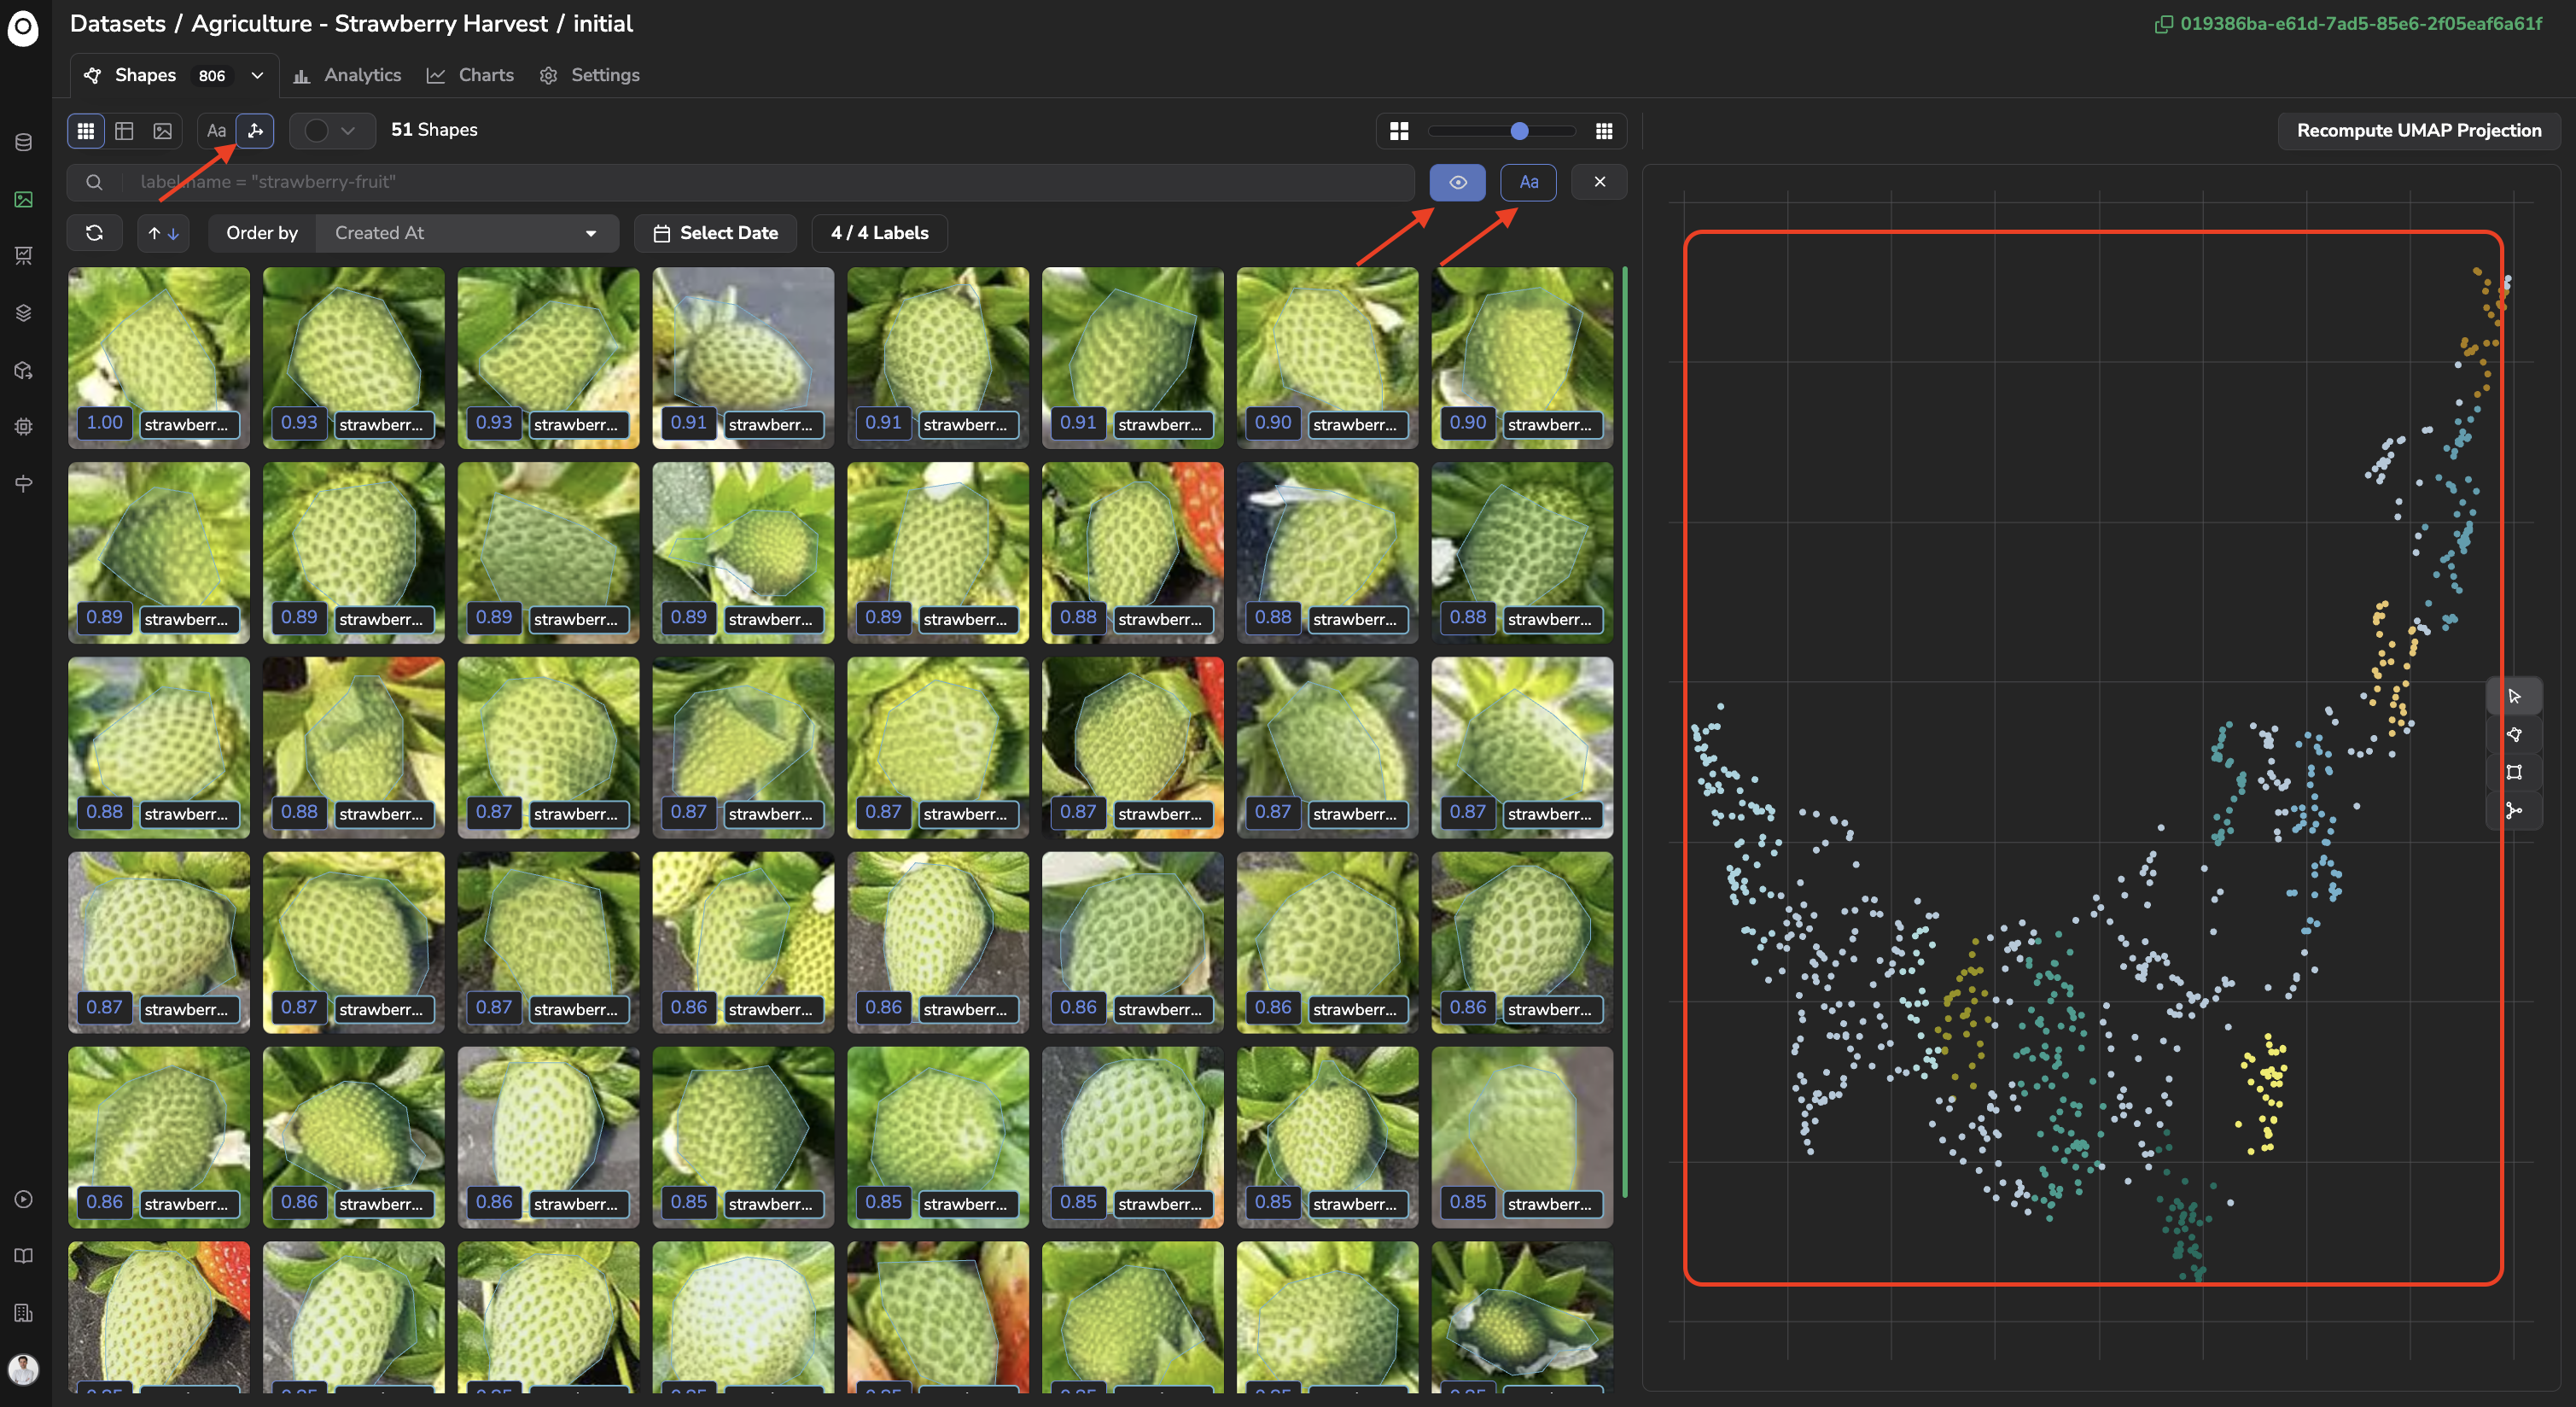
Embeddings-based features for Shapes view
These features rely on the embeddings computation for each Shape; this computation needs to be activated in the Settings page of the DatasetVersion, in the Shape Embeddings tab.
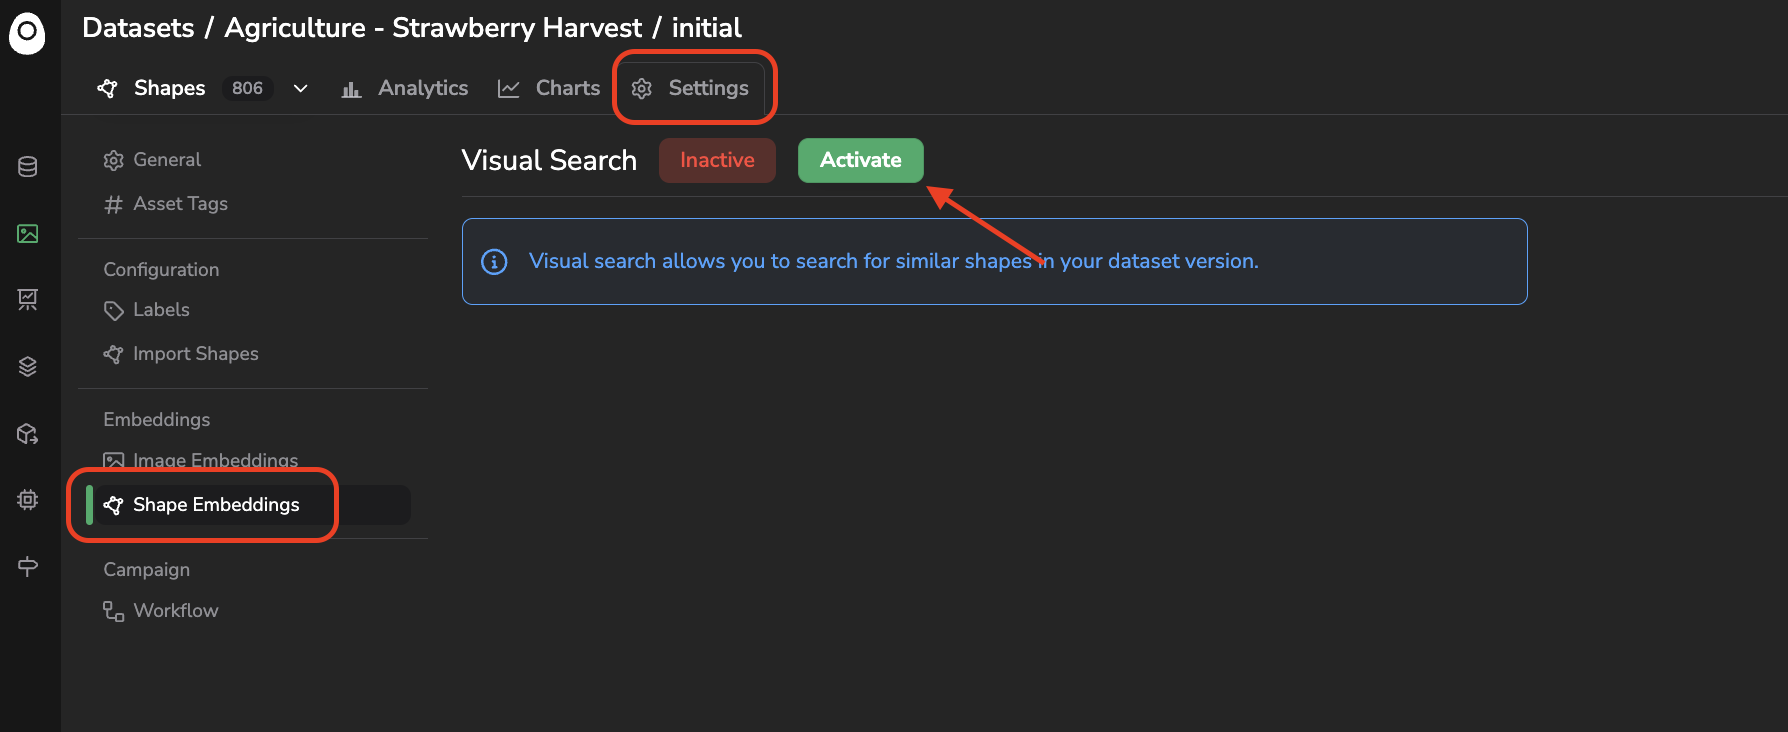
Shapes embeddings activation
5. Shape selection and deletion
Shape selection and deletionFrom the Shapes view, you can order your Shape by Created At.
To select Shape from the Shapes view, manually check the tick box on each Shape, or select all displayed Shape at once. Once Shape are selected, the only available action is Delete Shapes.
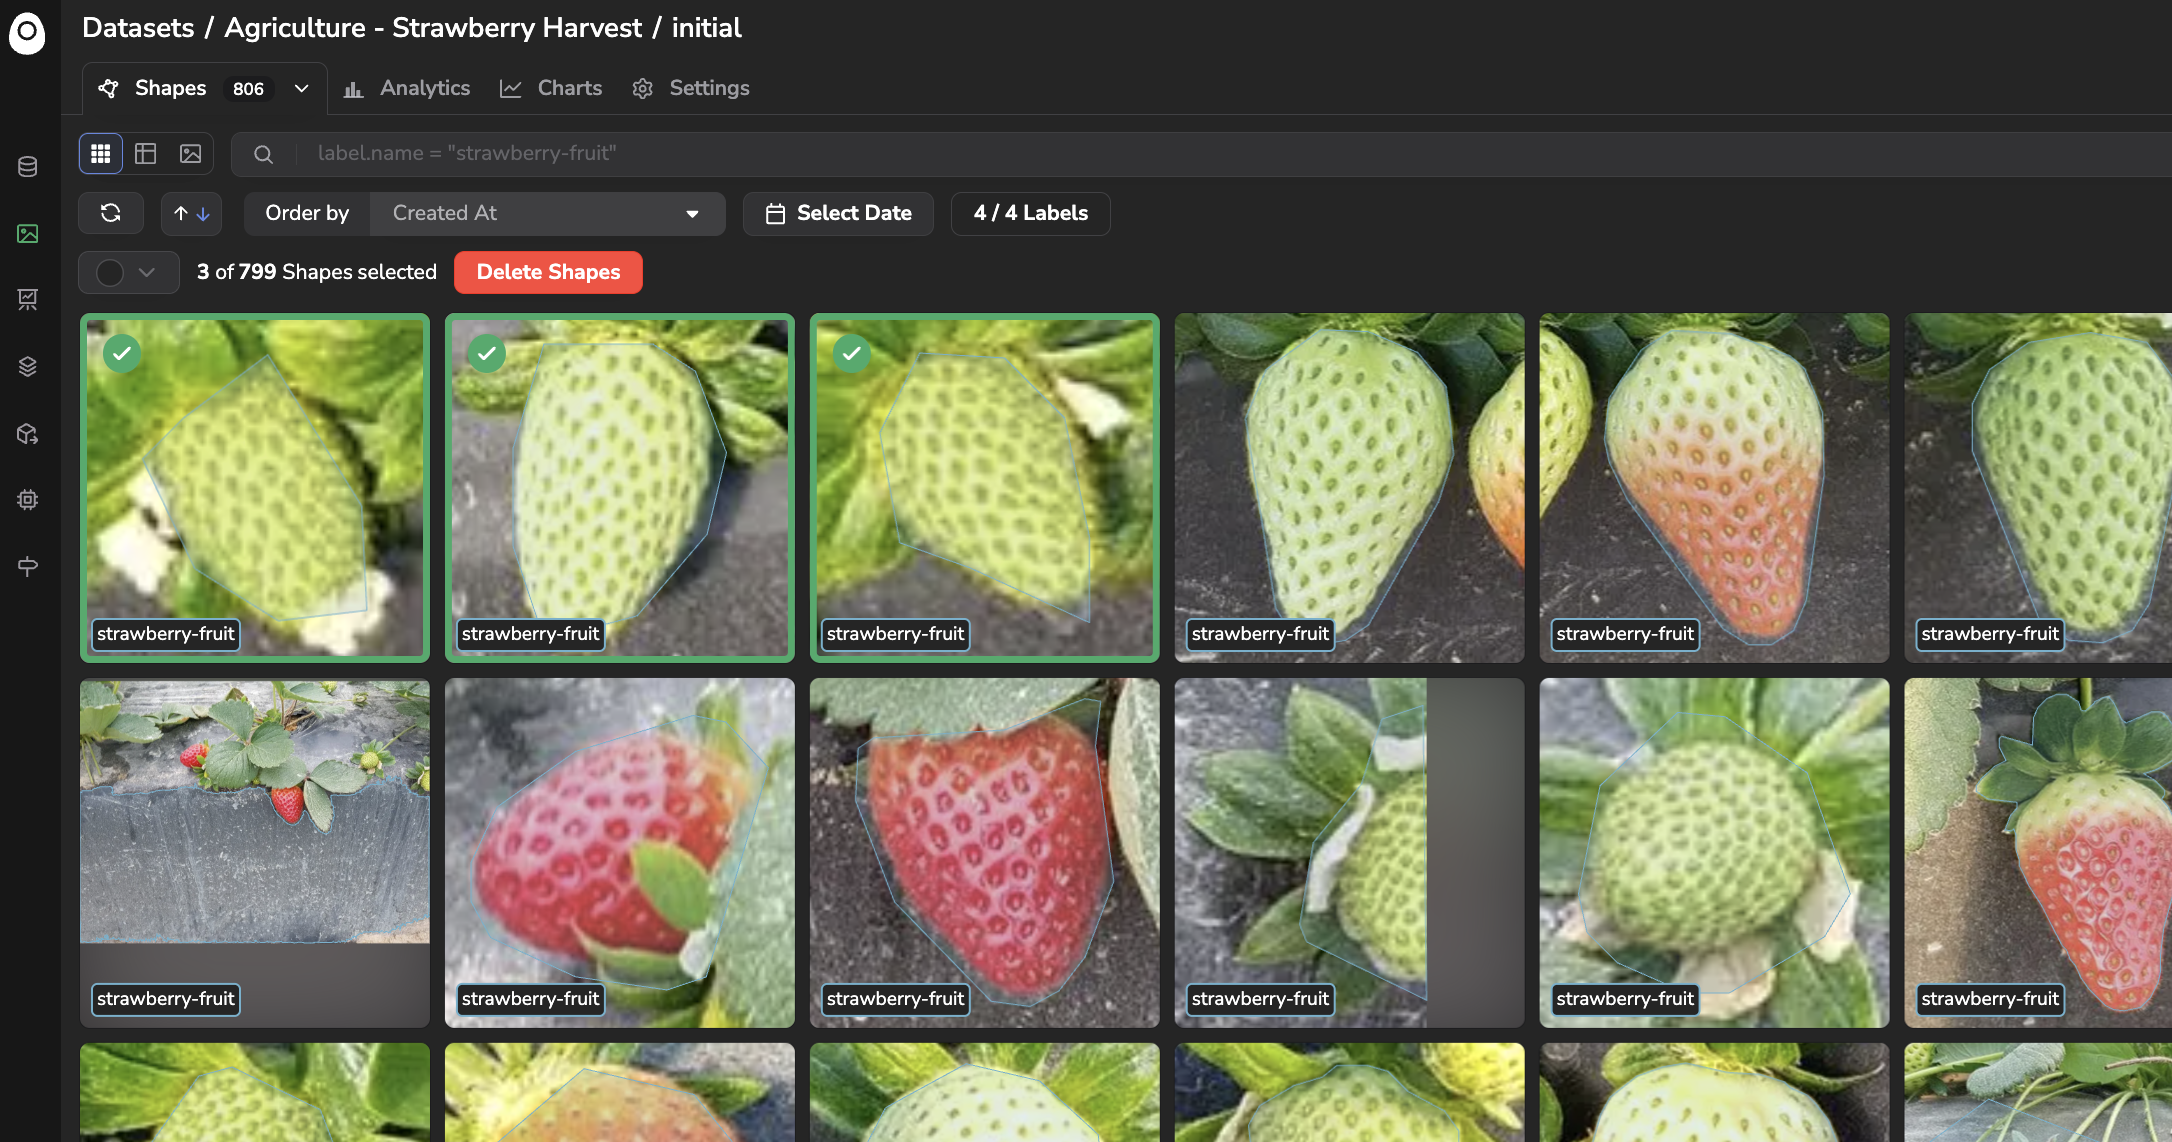
Shapes selection and deletion
Updated 2 months ago